TL;DR: The Short Version
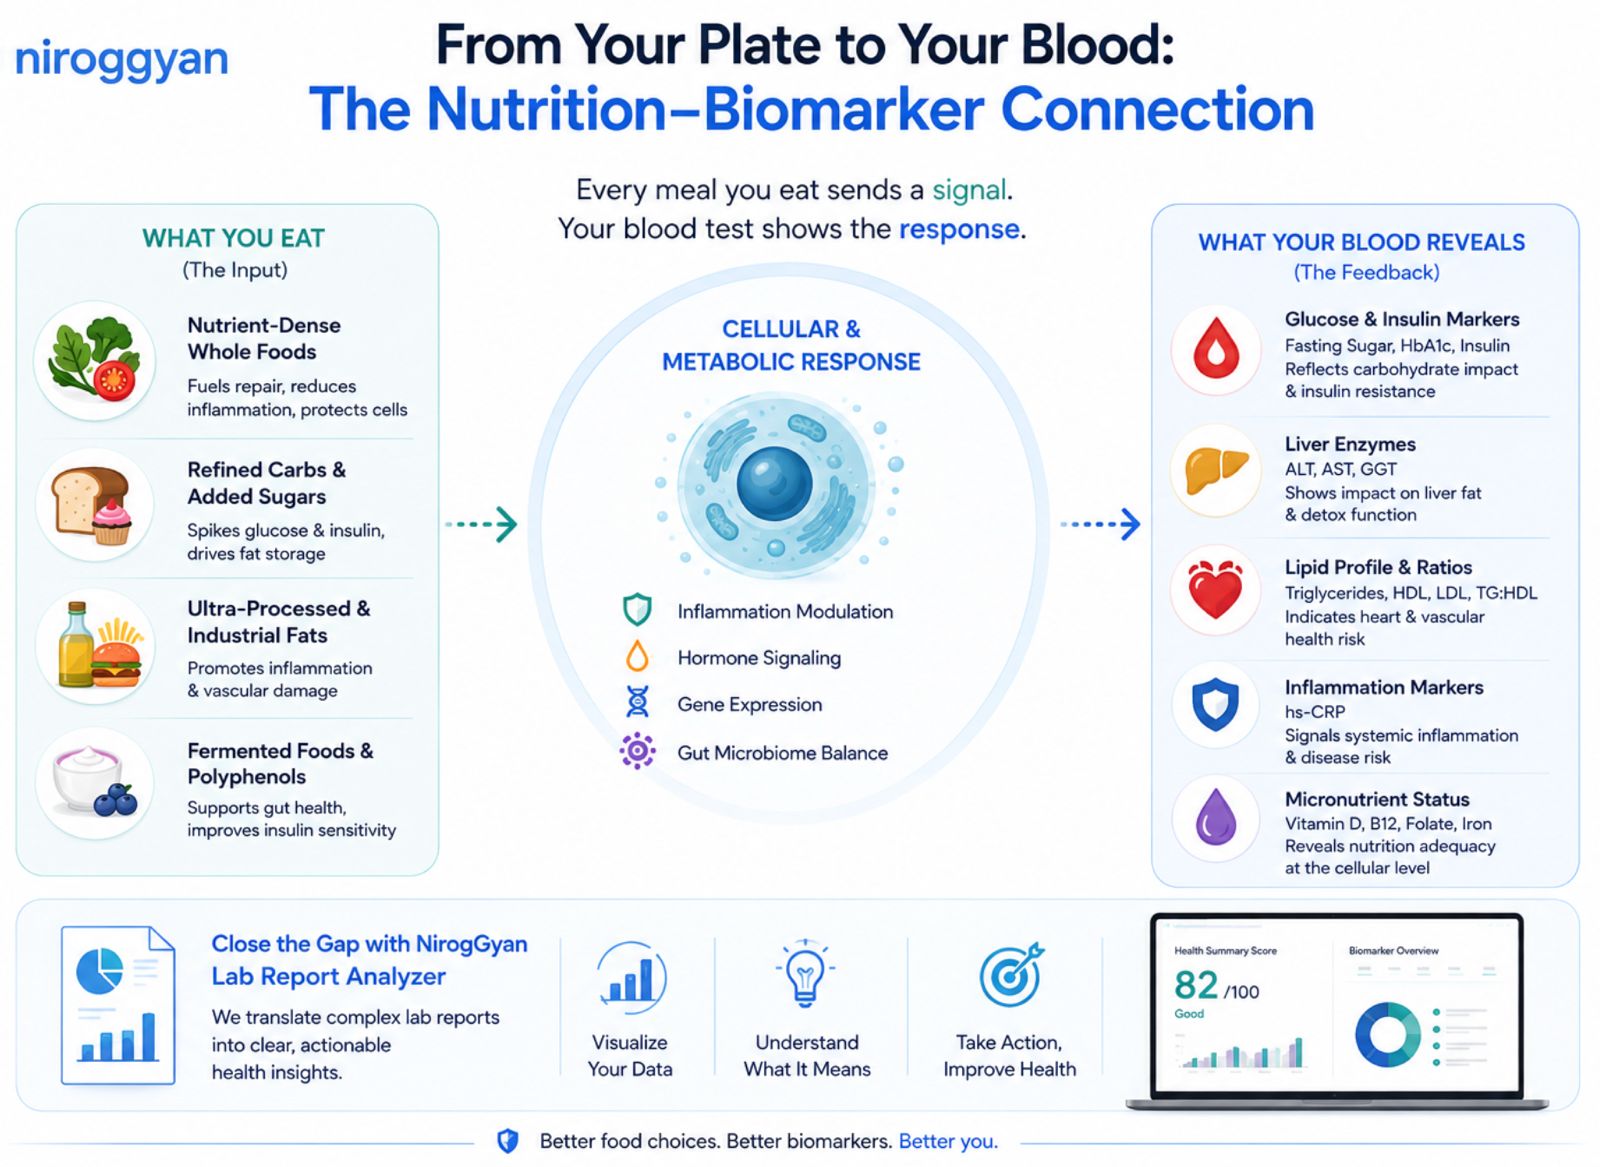
Every meal you eat is a biological input. Your body converts it into hormone signals, inflammation levels, and cellular activity, and your blood test is the readout of that process. Understanding this plate-to-blood connection turns a routine lab report from a wall of numbers into a practical guide for what to eat differently.
Food Is Not Just Fuel. It Is Information.
It is easy to think of food only as energy: calories in, calories burned. But at a biological level, every meal also carries instructions. Sugar tells your pancreas to release insulin. Saturated fat tells your liver to adjust how it processes cholesterol. Polyphenols in vegetables tell your gut bacteria to shift their balance. None of this is visible on a plate, but all of it becomes visible in a blood test weeks or months later.
This is why two people can eat very differently for years and end up with very different lab reports, even if neither one has any symptoms. The blood test is simply catching up on a conversation the body has been having internally for a long time.
What You Eat Sends a Signal
Nutrient-Dense Whole Foods
Vegetables, fruits, whole grains, and lean proteins supply the raw material your cells use for repair. They tend to lower inflammation and protect cells from everyday oxidative stress, which is one reason diets built around whole foods are consistently linked to healthier long-term lab markers.
Refined Carbs and Added Sugars
White bread, pastries, and sugary drinks are absorbed quickly, which spikes blood glucose and forces a large insulin response. Repeated spikes, meal after meal, are a major driver of the fat storage and insulin resistance patterns that show up in fasting glucose and HbA1c results over time.
Ultra-Processed Foods and Industrial Fats
Packaged snacks, fried foods, and industrially processed oils are associated with higher systemic inflammation and added strain on blood vessels. This is one of the patterns most closely tied to unfavourable lipid and inflammation markers on a standard panel.
Fermented Foods and Polyphenols
Curd, fermented vegetables, and polyphenol-rich foods such as berries and green tea support a healthier gut microbiome. A balanced gut has downstream effects on insulin sensitivity and inflammation, both of which are measurable on a lab report.
Inside the Cell: How Your Body Processes the Signal
Between the plate and the blood test, food passes through a layer of cellular and metabolic processing. Four things happen at roughly the same time, and each one eventually leaves a trace in your blood work.
- Inflammation modulation: certain foods calm inflammatory activity, others provoke it, and the balance shows up in markers like hs-CRP.
- Hormone signalling: insulin, cortisol, and thyroid hormones all respond to what and when you eat, shaping glucose and metabolic panels.
- Gene expression: nutrients can switch certain genes involved in metabolism and repair on or off, influencing how efficiently your body handles future meals.
- Gut microbiome balance: the bacteria in your gut shift based on diet, and that balance affects everything from nutrient absorption to inflammation levels.
What Your Blood Test Is Actually Telling You
Glucose and Insulin Markers
Fasting glucose, HbA1c, and fasting insulin reflect how well your body is managing carbohydrate load. Gradual upward drift here is one of the earliest signs of insulin resistance, often years before any symptom appears.
Liver Enzymes
ALT, AST, and GGT show how much strain your liver is under, including strain from excess sugar and processed fat that the liver has to convert or store.
Lipid Profile and Ratios
Triglycerides, HDL, LDL, and especially the TG:HDL ratio reflect the type of fat and carbohydrate pattern in your diet more than most people realise, and they are a strong indicator of cardiovascular risk.
Inflammation Markers
hs-CRP is a direct readout of systemic inflammation, which is heavily influenced by ultra-processed food intake and, in the other direction, by whole-food and polyphenol-rich diets.
Micronutrient Status
Vitamin D, B12, folate, and iron levels reveal whether your diet is actually supplying what your cells need at a basic level, independent of calorie intake.
Food Pattern vs. Biomarker Impact
| Food Pattern | What It Does Inside the Body | Biomarkers Most Affected |
| Nutrient-dense whole foods | Fuels repair, lowers inflammation | hs-CRP, HbA1c, Lipid Profile |
| Refined carbs and added sugar | Spikes glucose and insulin | Fasting Glucose, HbA1c, Triglycerides |
| Ultra-processed and industrial fats | Raises inflammation and vascular strain | LDL, TG:HDL Ratio, hs-CRP |
| Fermented foods and polyphenols | Improves insulin sensitivity and gut balance | HbA1c, Fasting Insulin, Micronutrient Panel |
Closing the Loop With the NirogGyan Lab Report Analyzer
Knowing that food affects biomarkers is only useful if you can see the effect clearly. Most lab reports are handed back as a dense PDF of numbers and reference ranges, with no explanation of what changed or why.
The NirogGyan Lab Report Analyzer takes that same report and turns it into a visual, plain-language summary: an overall health score, a colour-coded breakdown by system, and clear notes on which markers moved and what that is likely connected to.
Instead of reading a report once and forgetting it, you can track it over time, see whether a change in diet actually shifted your numbers, and know what to focus on next.
The Simple Takeaway
- Food is a signal, not just fuel: what you eat is processed into hormonal and inflammatory activity long before it becomes a symptom.
- Your blood test is feedback: it reflects weeks or months of dietary patterns, not just what you ate yesterday.
- Small, consistent shifts matter more than one clean day: regularly choosing whole foods over processed ones is what moves markers like HbA1c and hs-CRP.
- Track it, don't guess: a report you can actually understand is what turns this feedback loop into something actionable.
Ready to see what your last meal pattern did to your blood work?
Try the Lab Report Analyzer Free