Integrating NLP and Data Visualization into Lab Reports: A Game Changer
Author: Joyneel Acharya
Last Updated On: 4th September 2025
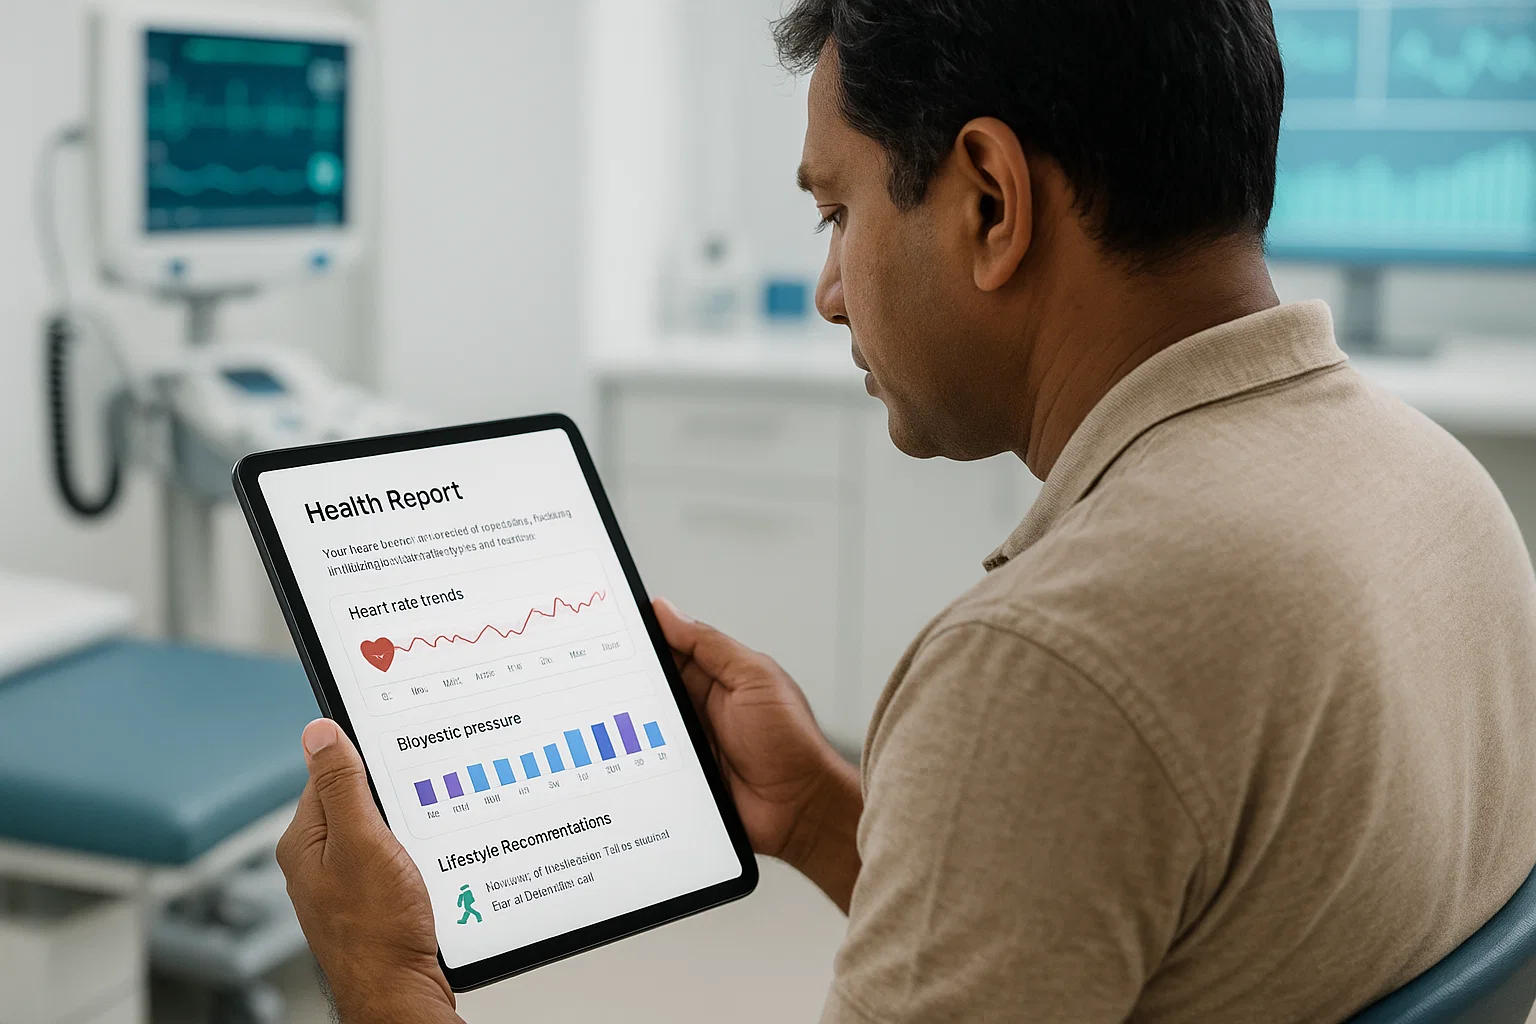
As pioneers in health-tech, we at NirogGyan™ have analysed over numerous lab reports, and one truth has become crystal clear: the future of diagnostics isn't just about data; it's about making that data tell a story. The integration of Natural Language Processing (NLP) and data visualization is the pen that writes this new chapter, transforming dense lab reports into clear, actionable health narratives. By translating complex medical jargon into understandable language and visually highlighting key insights, we are empowering both clinicians and patients. This isn't just an upgrade, it's a revolution in how we communicate health.
Key Takeaways
- Integrating NLP with data visualization in medical lab reports enhances clarity by translating complex medical jargon into understandable language and highlighting key insights visually.
- NLP automates extraction and standardization of critical patient information, enabling faster interpretation and reducing manual errors in lab result analysis.
- Data visualization tools convert raw lab data into intuitive charts and graphs, facilitating quicker identification of abnormal trends and supporting timely clinical decisions.
- Traditional lab reports suffer from inconsistent formats, dense jargon, and manual processes that increase error risk and delay diagnosis.
- The combined use of NLP and visualization improves patient engagement by making reports more accessible and easier to comprehend.
- This integration supports better tracking of patient results over time and across labs, enhancing monitoring and diagnostic accuracy.
Understanding Traditional Lab Reports and Their Limitations
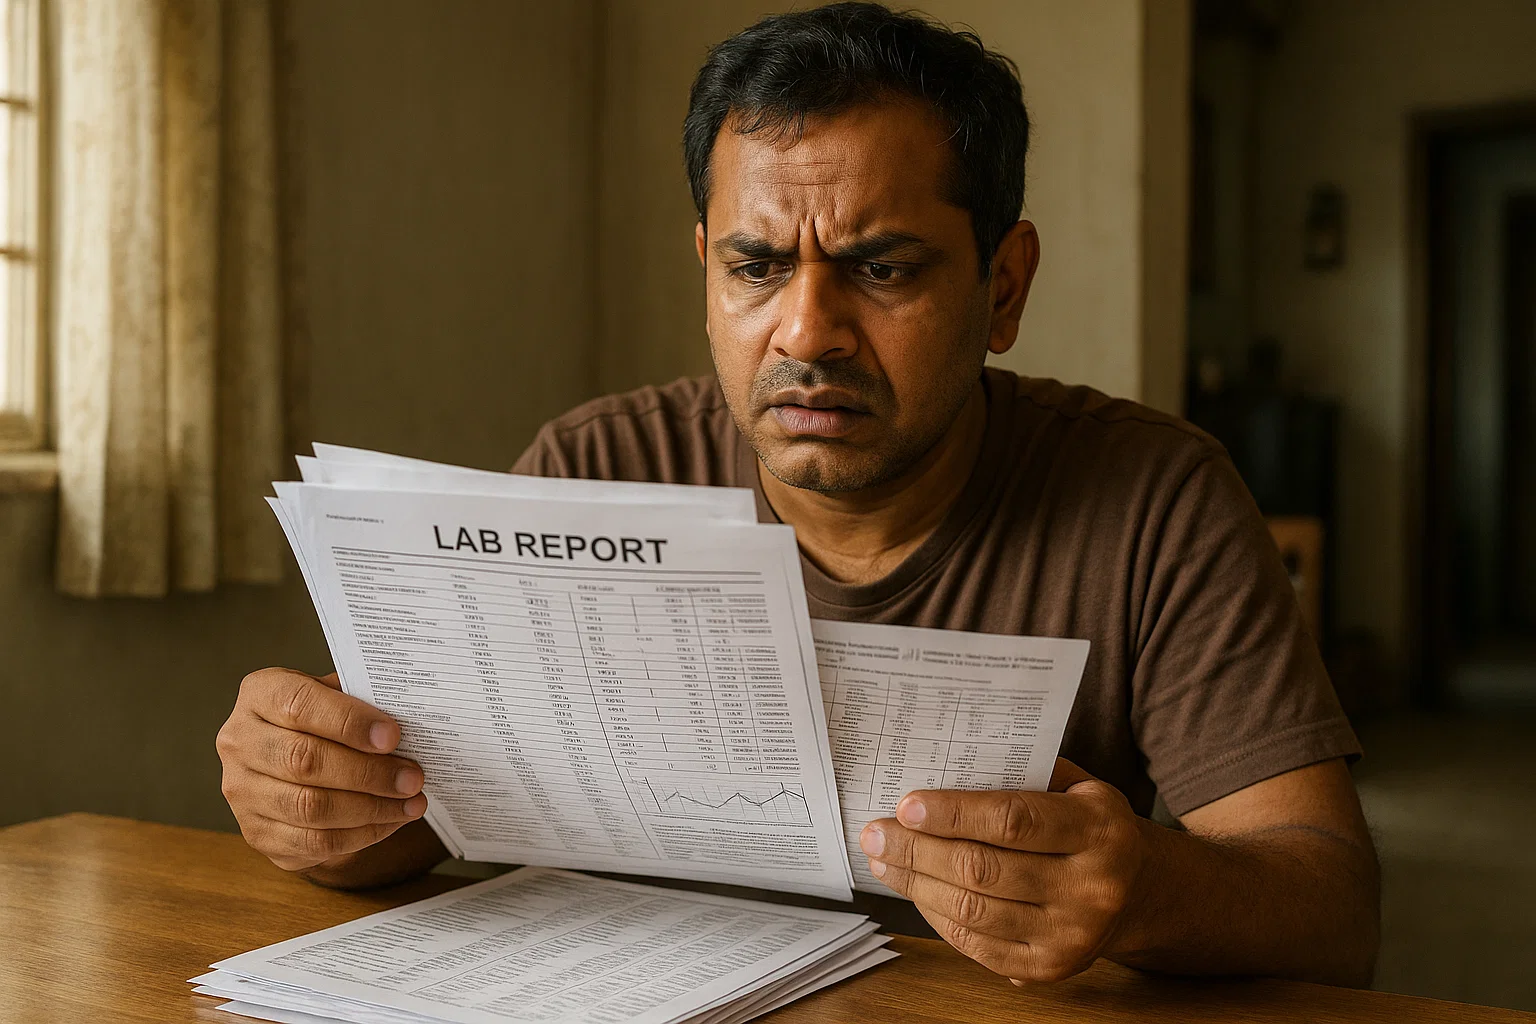
For decades, the traditional lab report has been the cornerstone of clinical diagnosis. Yet, healthcare providers tell us a consistent story of frustration. These reports, often dense with jargon and presented in inconsistent formats, create barriers to understanding for patients and even for clinicians who must quickly synthesise information. Manual data entry and paper-based systems introduce a significant risk of human error, with some studies showing clinical error rates as high as 50%.
In our work with diagnostic labs across India, we’ve seen these challenges firsthand. A lack of standardized formats means a patient’s vitamin D level can be reported differently from one lab to another, complicating longitudinal tracking and clinical decision-making.
Here’s a snapshot of what we’ve observed:
- Lack of Standardization: Inconsistent formats across different labs lead to confusion and delays in interpretation.
- Communication Delays: Manual processes and paper records slow down data retrieval and the delivery of critical results.
- Difficulty in Tracking: Comparing patient results over time or across multiple labs is often a cumbersome, manual task.
- Poor Clarity: Jargon-filled text can easily lead to misinterpretation, delaying accurate diagnosis and treatment.
These limitations don't just create inefficiencies; they pose a direct risk to patient outcomes.
What is Natural Language Processing (NLP) and Its Role in Lab Reports?
At its core, Natural Language Processing (NLP) is a branch of artificial intelligence that gives computers the ability to understand and interpret human language. For lab reports, this is a transformative capability. What we've discovered through our AI algorithms is that NLP can systematically process unstructured text-such as clinician notes or nuanced test descriptions, and convert it into structured, analysable data.
Here’s how NLP is revolutionizing the process:
- Automated Extraction: NLP algorithms automatically pull critical information like diagnoses, specific lab values, and treatment notes from text.
- Intelligent Standardization: The technology standardizes medical terminology, ensuring that data from different sources is consistent and comparable.
- Rapid Summarization: NLP can generate concise summaries of lengthy reports, highlighting the most essential findings for quick clinician review.
Quick Facts
- Speed: NLP can reduce the time needed for manual review of complex reports by up to 70%.
- Accuracy: Automation via NLP helps reduce the manual errors common in data entry and interpretation.
- Insight: By structuring unstructured data, NLP uncovers trends that would otherwise remain hidden in text-heavy reports.
For example, our system can automatically identify an abnormal result like a low haemoglobin count, flag it for review, and contextualize it with insights from past reports, significantly reducing the risk of manual oversight and speeding up diagnosis.
The Power of Data Visualization in Enhancing Lab Results Interpretation
If NLP gives data a voice, then data visualization gives it a face. It transforms rows of numbers and clinical terms into intuitive charts, graphs, and visual dashboards that make complex information immediately understandable. Healthcare providers tell us that this visual clarity is a game-changer, allowing them to spot abnormal trends, patterns, and outliers in seconds, a task that could take minutes with a traditional text-based report.
The "Before and After" Scenario
- Before (Traditional Report): A clinician scans a dense table of glucose readings over six months, manually comparing numbers to identify a slow but steady increase. The patient sees a list of dates and values that are difficult to interpret without expert guidance.
- After (Visualized Report): A dynamic dashboard instantly displays the glucose readings as a trend line, clearly showing the upward trajectory. A color-coded alert highlights when the values crossed into the pre-diabetic range. The patient can see their progress visually, improving their engagement and understanding.
This isn't just about aesthetics; it's about accelerating data-driven decisions and enhancing communication between providers and patients.
Integrating NLP and Data Visualization: Transforming Lab Reports
The true magic happens when these two technologies converge. By integrating NLP with data visualization, we create a synergistic system that turns a static document into an interactive, intelligent report. NLP first extracts and structures the critical insights from all the text, and then data visualization presents those insights in a clear, compelling visual format.
This powerful combination enables:
- Automated Summaries: Critical findings are automatically summarized and presented for rapid review.
- Visual Alerts: Abnormal or urgent values are flagged with visual cues, demanding immediate attention.
- Enhanced Engagement: Simplified visuals and plain-language explanations empower patients to take an active role in their health management.
Automating Interpretation of Blood Test and Clinical Test Reports
In our analysis of 300,000+ reports, we’ve found that automating the interpretation of blood test and other clinical test reports is one of the most impactful applications of this integrated technology. Our deep learning NLP models are trained on vast clinical datasets to extract key variables, like cholesterol counts, infection markers, or liver function enzymes, from unstructured text with incredible accuracy. This allows for the instant flagging of abnormal results and the detection of subtle trends over time.
A diagnostic lab we partnered with was struggling with turnaround times for their complex hormonal panels. By implementing our NLP-driven system, they automated the initial flagging of abnormal results. This didn't replace their pathologists but instead armed them with a pre-analysed report, allowing them to focus their expertise on the most critical cases. They reported a 40% reduction in interpretation time and a significant decrease in transcription errors.
Visual Dashboards and Interactive Lab Report Examples
Static PDFs are becoming relics of the past. The new standard is a visual dashboard that provides an at-a-glance overview of a patient's health status.
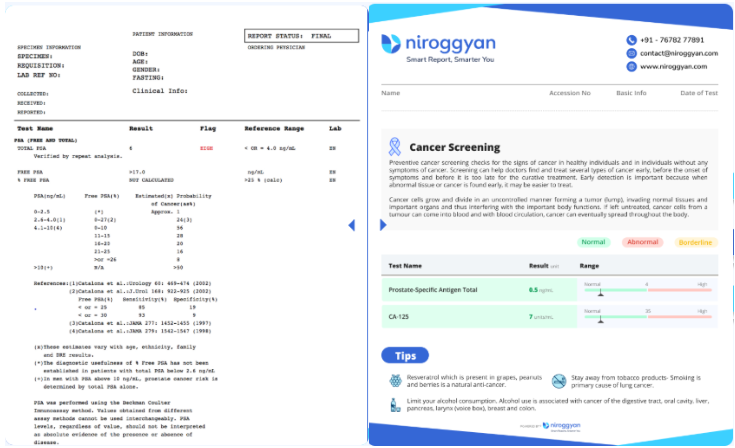
These interactive dashboards often include:
- Real-time Updates: Data is updated as soon as it's available, enabling faster clinical decisions.
- Trend Analysis: Users can easily track patient progress over months or years, comparing historical values with a single click.
- EHR Integration: Seamless integration with Electronic Health Records (EHRs) provides a holistic view of the patient’s health journey.
Benefits of NLP and Data Visualization Integration for Stakeholders
The impact of this technological fusion extends across the entire healthcare ecosystem.
| Stakeholder | Key Benefits | Example |
| Patients | Better Understanding & Engagement | Jargon-free explanations and visual charts empower patients, improving adherence to treatment plans. |
| Clinicians | Faster, More Accurate Decisions | Automated summarization and visual alerts highlight critical trends, accelerating diagnosis and intervention. |
| Diagnostic Labs | Improved Efficiency & Accuracy | Automation reduces manual errors, streamlines workflows, and delivers a higher-value product to clinicians. |
Challenges and Considerations in Implementing These Technologies in Medical Labs
Adopting these transformative technologies is not without its hurdles. We advise our partners to consider these key challenges:
- Data Privacy and Security: Protecting sensitive patient information is non-negotiable. Any solution must comply with data protection regulations and employ robust encryption.
- Integration with Legacy Systems: Many labs operate on older LIS or EHR systems. Successful implementation requires careful planning to ensure interoperability.
- Ensuring NLP Accuracy: The models must be rigorously validated to minimize misinterpretations that could impact a diagnosis. This requires continuous training and quality control.
- User Adoption and Training: Staff may be resistant to changes in workflow. A successful transition requires comprehensive training and demonstrating the clear benefits of the new system.
Future Outlook: The Next Steps for Lab Reports in Healthcare
We are only at the beginning of this transformation. The future of lab reports is predictive, personalized, and proactive.
What we’ve discovered through our AI algorithms is that we can move beyond reporting current results to predicting future risks. Imagine a lab report that doesn’t just show high cholesterol but also uses predictive analytics to flag a patient’s rising 10-year risk for cardiovascular disease, prompting early intervention.
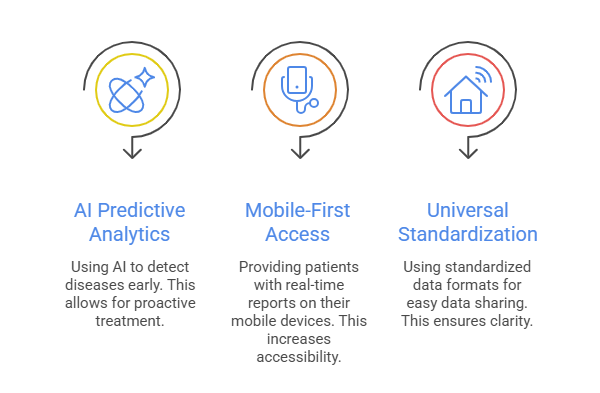
Key trends shaping the future include:
- AI-Driven Predictive Analytics: Shifting from reactive diagnosis to proactive, early disease detection.
- Mobile-First Access: Delivering real-time, patient-friendly reports directly to mobile devices.
- Universal Standardization: Adopting standardized data formats for seamless data sharing and universal clarity.
Conclusion: Embracing the Future of Lab Reports with NLP and Data Visualization
The integration of NLP and data visualization is fundamentally reshaping the landscape of diagnostic reporting. By converting complex data into clear, actionable intelligence, we are empowering clinicians to make faster, more informed decisions and enabling patients to become active participants in their own health journeys. For diagnostic labs and healthcare providers, embracing these technologies is no longer an option, it is the key to improving efficiency, enhancing patient care, and leading the future of healthcare.
Frequently asked questions (FAQs)
1. What is the role of NLP in medical lab reports?
Natural Language Processing (NLP) extracts key information, standardizes medical terminology, and summarizes complex lab data, making reports easier for both clinicians and patients to interpret.
2. How does data visualization improve lab report accuracy?
Data visualization converts raw test results into intuitive charts, graphs, and trend lines, helping clinicians quickly identify abnormalities and patients better understand their health status.
3. What are the benefits of combining NLP and data visualization in lab reports?
Together, NLP and visualization simplify medical jargon, highlight critical trends, and reduce manual errors, leading to faster diagnoses, improved patient engagement, and more consistent reporting.
4. What challenges exist in implementing NLP and visualization in labs?
Key challenges include data privacy compliance, integrating with legacy systems, and ensuring NLP accuracy. Proper validation and staff training are essential for successful adoption.
5. What is the future of lab reports with AI, NLP, and visualization?
Future lab reports will be interactive, mobile-friendly, and predictive- using AI analytics to detect early disease risks, integrate with EHRs, and deliver personalized health insights in real time.
"Get personalized health insights with NirogGyan's Smart Reports. Start today for actionable, tailored health data!"