TL;DR: The Short Version
"Why should I get tested if I have zero symptoms?" is one of the most common questions in modern healthcare. The reality is that the human body is an expert compensator. Long before you feel pain, fatigue, or discomfort, your internal biology works overtime to keep visible systems stable. By the time symptoms appear, metabolic drift has often been underway for years.
Routine preventive screening acts as a flight recorder for your biology, catching subtle shifts in markers like HbA1c, liver enzymes, and lipid ratios while they can still be reversed with simple lifestyle tweaks. NirogGyan's Lab Report Analyzer converts static, complex lab PDFs into clear, visual health intelligence.
The 'I Feel Fine' Paradox
One of the most dangerous myths in personal health is equating the absence of symptoms with the presence of optimal health.
You wake up, complete your workday, exercise, and feel completely energetic. Naturally, booking a comprehensive blood test feels like a low priority. Why investigate a machine that seems to run smoothly?
The answer lies in human evolutionary biology: your body is built to compensate at all costs.
When blood sugar regulation begins to falter, your pancreas does not immediately give up — it pumps out two to three times more insulin to keep fasting glucose looking normal. When arteries begin accumulating plaque, vascular walls remodel and expand outward for years before the lumen narrows enough to cause chest tightness or breathlessness.
Your body quietly absorbs metabolic damage and hides dysfunction for as long as it possibly can. By the time a physical symptom forces you into a clinic, you are no longer dealing with early risk — you are managing an established disease.
Drift vs. Disease: The Hidden Timeline
Every chronic metabolic condition follows a distinct trajectory. The transition from pristine biological health to chronic illness develops along a spectrum.
1. The Stage of Optimal Health
All biomarkers sit comfortably within functional target ranges. Energy production is efficient, vascular inflammation is minimal, and organ systems operate with high physiological reserve.
2. The Stage of Drift (The Golden Window)
This is where preventive medicine wins. You feel 100% fine, but your biomarkers have started to shift:
- Fasting insulin and HbA1c: slowly climbing from 5.1% to 5.6%, signalling early insulin resistance.
- Liver enzymes (ALT/AST): creeping upward within the "normal" bracket due to subtle hepatic fat accumulation.
- Triglycerides-to-HDL ratio: expanding past 2.5, indicating smaller, denser, more atherogenic lipid particles.
- hs-CRP: mild elevations pointing toward low-grade systemic vascular inflammation.
3. The Stage of Dysregulation
Reference ranges are now visibly breached. Fasting glucose enters prediabetic territory, blood pressure creeps into stage-1 hypertension, and fatty liver becomes visible on ultrasound.
4. The Stage of Disease
The body's compensatory mechanisms are exhausted. Type 2 diabetes, clinical atherosclerosis, or metabolic syndrome are formally diagnosed — often requiring lifelong pharmacological management.
Lifestyle interventions are exponentially more effective during the stage of drift than during the stage of disease. Catching a biomarker drift gives you the ultimate advantage: time.
Why Traditional Blood Test Reports Fail You
If early detection is so valuable, why do so many people avoid regular testing — or ignore the reports they receive? The problem is not lack of intent. It is the delivery format.
For decades, the standard diagnostic report has been designed as a technical billing and reference receipt for laboratories and clinicians. When everyday individuals open these documents, they face three barriers:
- Static snapshots. A standard report shows what happened on a single morning. It cannot show whether a number has been quietly creeping up over three years.
- Arbitrary 'normal' brackets. Standard lab reference ranges are broad population averages, not optimised targets. A marker at the very edge of 'normal' can be in active metabolic drift.
- Jargon and anxiety. Out-of-range flags in bold red text trigger panic without providing context on severity or practical next steps.
Meet the Solution: The NirogGyan Lab Report Analyzer
To solve the understanding gap, NirogGyan built the Lab Report Analyzer — an intelligent tool that converts raw diagnostic lab files into intuitive, visual health narratives.
Instead of deciphering rows of clinical abbreviations on your own, upload your existing blood test report directly to the platform.
What the Analyzer delivers
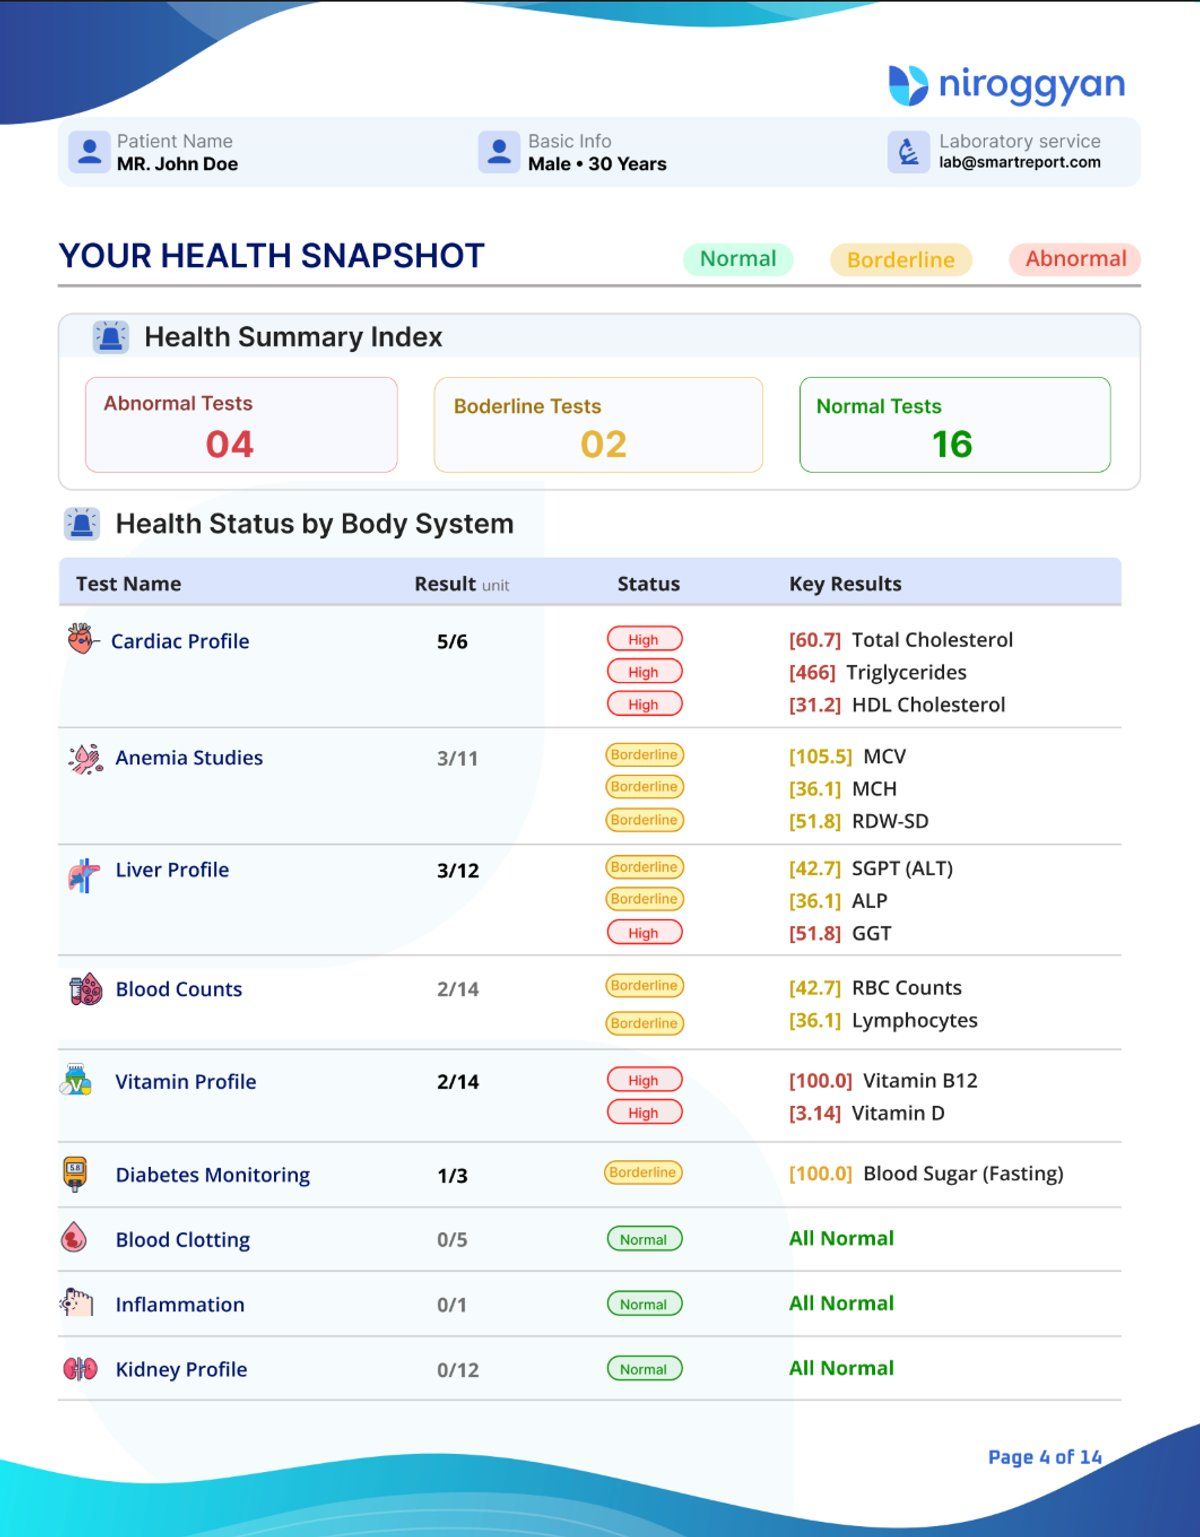
- Instant clarity across organ systems. Biomarkers are automatically organised into clear functional groups: Metabolic, Cardiovascular, Liver, Kidney, Hematology, and Micronutrients.
- Visual risk spectrum. Colour-coded visual scales show exactly where each number lands, separating optimal performance from borderline drift.
- Smart ratio calculations. Automatically calculates vital metabolic markers that standard lab PDFs omit — such as the Triglyceride-to-HDL ratio and Non-HDL cholesterol.
- Human-language insights. Plain-language explanations clarify what each test evaluates, why it matters, and how diet, exercise, and sleep influence that biomarker.
- Doctor discussion points. Prepares you with specific, informed questions for your next consultation.
Traditional Lab PDFs vs. The NirogGyan Analyzer
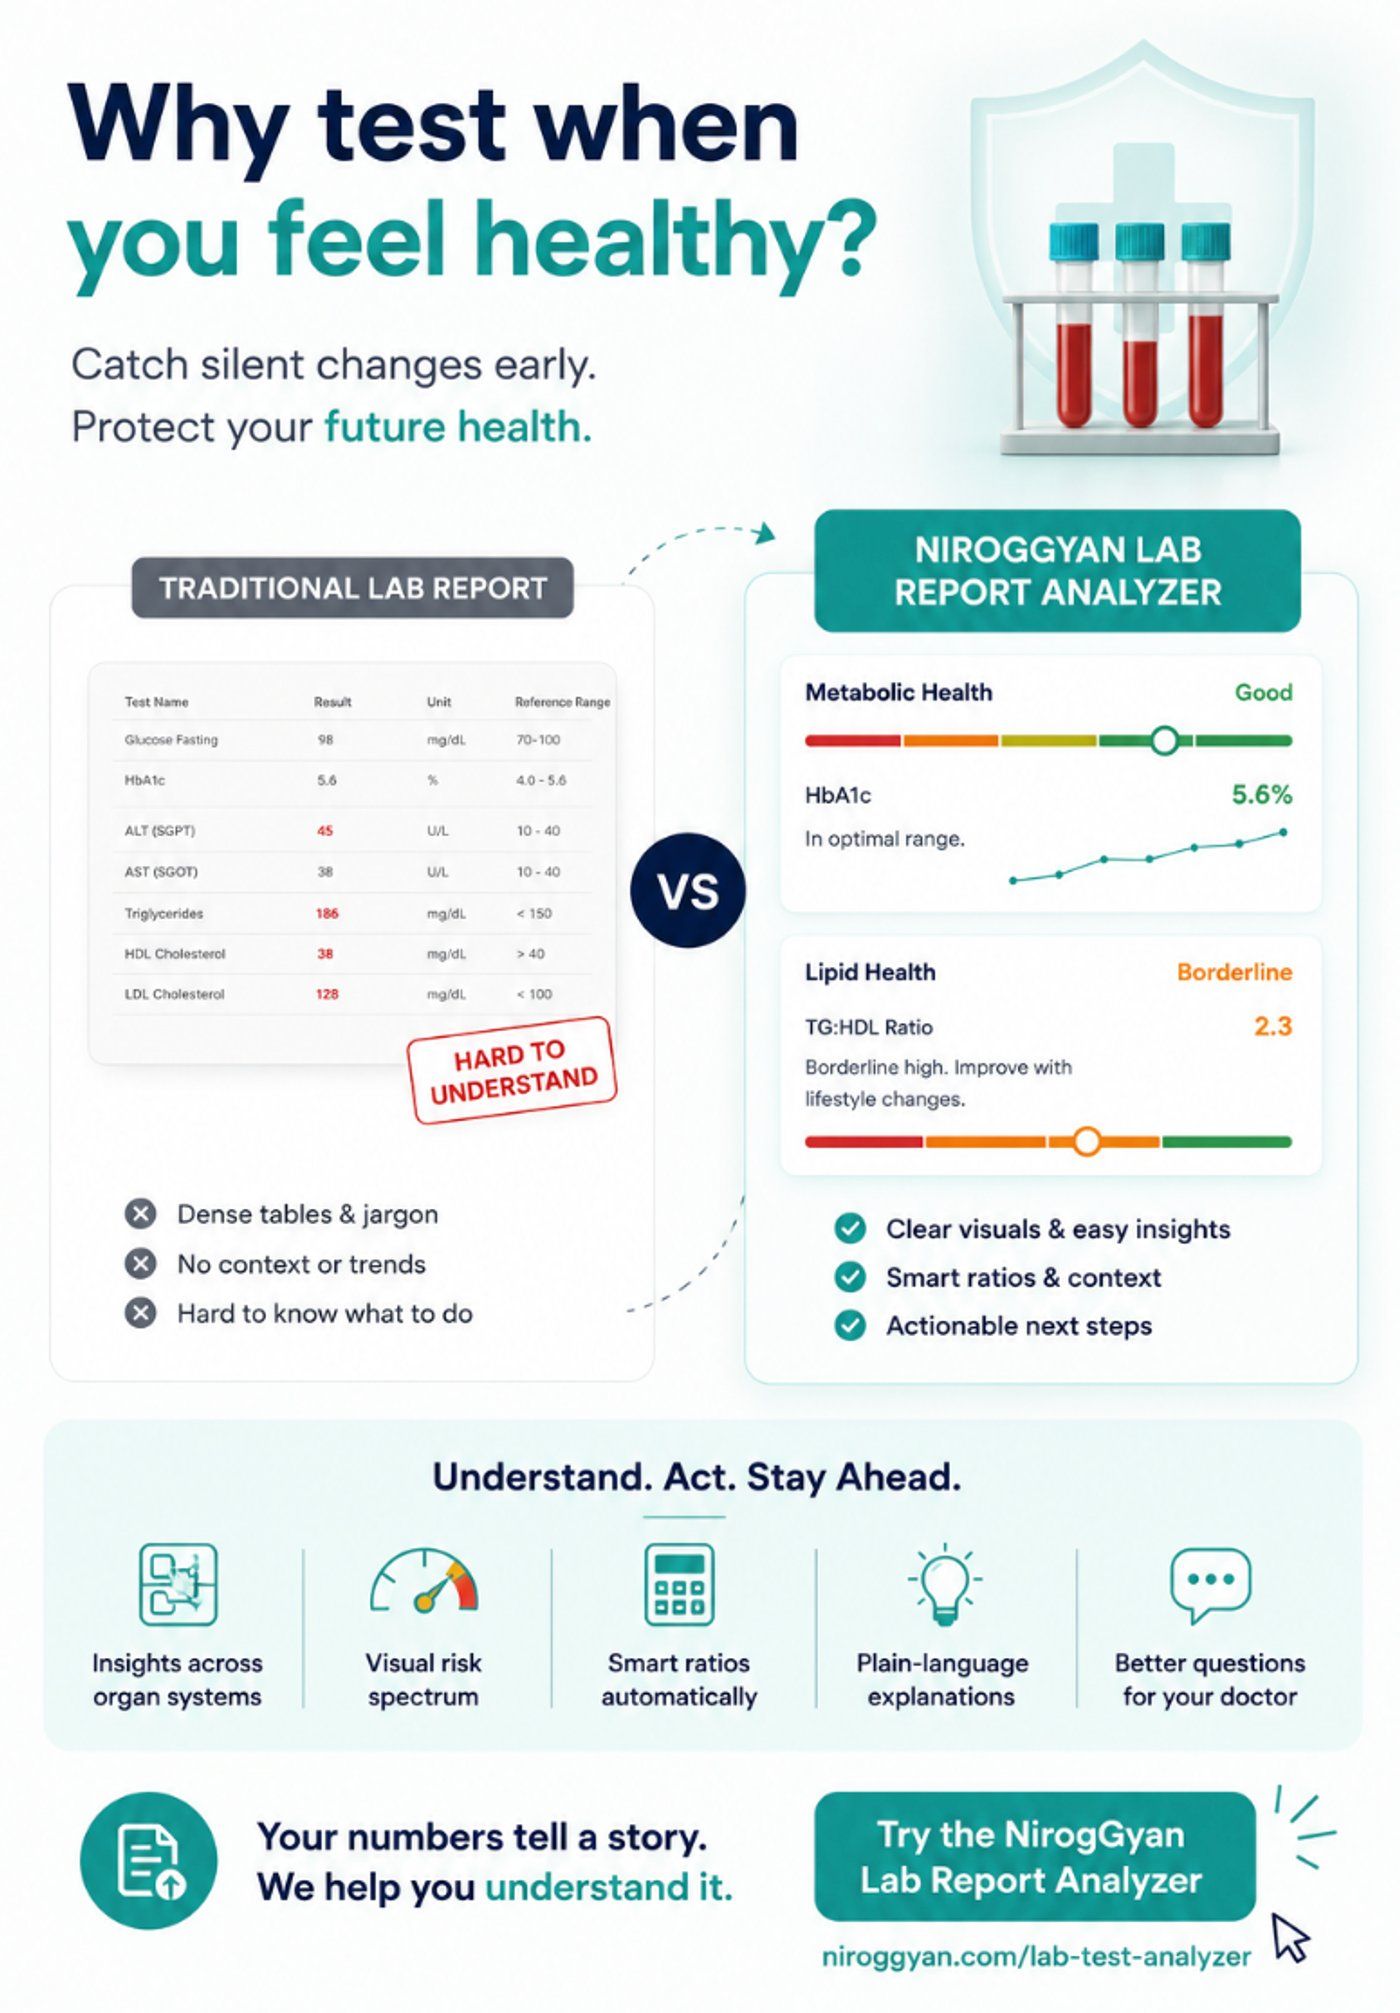
| Feature | Traditional Lab PDF | NirogGyan Lab Report Analyzer |
| Data presentation | Dense tables and black-and-white text | Clean, colour-coded visual spectrums |
| Context level | Raw values vs broad population norms | Tiered risk: Optimal, Borderline, High |
| Calculated ratios | Rarely calculated or explained | Automatic TG:HDL, Non-HDL, and more |
| Patient readability | High clinical jargon | Plain-language, jargon-free explanations |
| Actionability | No lifestyle or nutritional context | Clear contextual insights and doctor points |
| Trend awareness | Static snapshot of a single day | Built to track baseline trajectory over time |
How to Use Your Blood Tests as an Active Health Tracker
Getting the most out of preventive diagnostics does not require monthly testing. It requires consistent, structured review:
- Establish an annual baseline. Run a comprehensive panel once a year: lipid profile, HbA1c, CBC, liver and kidney function, Vitamin D3, and Vitamin B12.
- Focus on key ratios. How markers interact matters more than any single isolated number.
- Track direction of change. A marker that stays within normal limits but steadily ticks upward year after year deserves proactive attention.
- Upload and review. Run your reports through the NirogGyan Lab Report Analyzer to see the big picture without guessing.
Frequently Asked Questions
Why should I get a blood test if I have no symptoms?
Many chronic health issues — including early insulin resistance, dyslipidemia, and fatty liver — develop without noticeable symptoms. Routine panels catch biochemical shifts during the early drift phase, when they can be corrected through simple diet and exercise modifications.
How does the NirogGyan Lab Report Analyzer work?
The analyzer extracts raw biomarker data from your diagnostic PDF or image, organises values by body system, calculates vital health ratios, and translates clinical numbers into visual scales with plain-language explanations.
Is the Lab Report Analyzer a substitute for my doctor?
No. The analyzer is an educational health literacy tool. It does not diagnose or prescribe. Instead, it prepares you with clear insights and informed questions to discuss with your healthcare provider.
What types of reports can I analyze?
You can analyze routine preventive panels, CBC, lipid profiles, metabolic panels, thyroid profiles, vitamin panels, and annual corporate health checkups.
Take Control of Your Health Data Today
Your health data belongs to you, and understanding it should not require a medical degree.
Stop letting annual health reports sit unread in your inbox. Discover what your biomarkers are telling you, identify subtle drifts before they become clinical concerns, and take charge of your preventive health journey.
Ready to see your health report in a whole new light?
Try the Lab Report Analyzer Free