TL;DR: The Short Version
Dyslipidemia — an unhealthy imbalance of blood fats — is one of the biggest silent drivers of heart disease across South Asia.
Unlike the classic Western profile where total cholesterol climbs sharply, the South Asian pattern is far subtler. It usually shows up as high triglycerides, low protective HDL, and normal-looking LDL that is quietly packed with small, dense, plaque-forming particles.
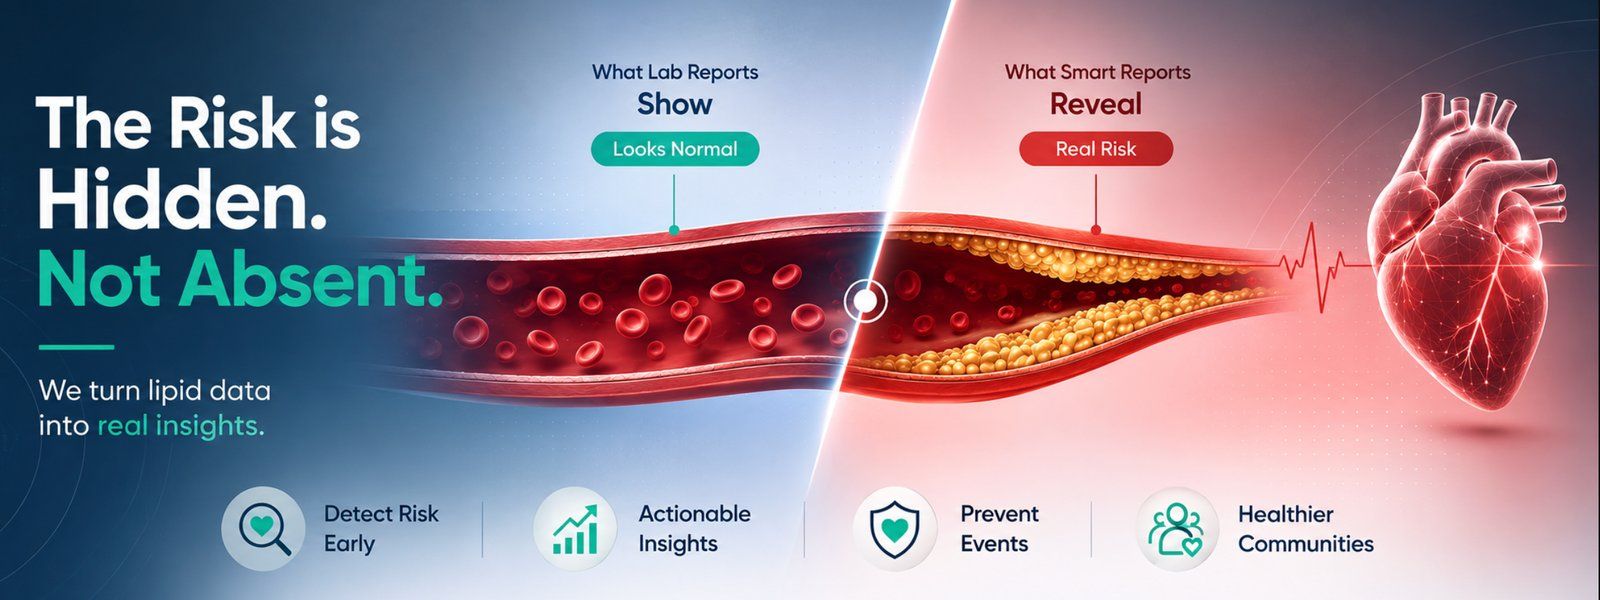
Reading a single "Total Cholesterol" number on a flat PDF gives millions of people a false sense of safety. NirogGyan helps diagnostic providers fix this by turning raw lipid numbers into visual, ratio-focused Smart Reports that surface real cardiovascular risk long before it becomes a crisis.
What Is Dyslipidemia?
Dyslipidemia refers to an unhealthy balance of lipids (fats) circulating in the bloodstream. It is not simply "high cholesterol" — it covers a broader set of imbalances across several markers:
- Elevated LDL cholesterol (LDL-C): the main carrier of cholesterol that can penetrate arterial walls and form plaque.
- Elevated triglycerides (TG): fat molecules formed from unused calories, strongly linked to insulin resistance, fatty liver, and metabolic stress.
- Low HDL cholesterol (HDL-C): insufficient levels of the protective lipoprotein responsible for clearing excess cholesterol from circulation.
- Elevated non-HDL cholesterol and ApoB: a direct count of all atherogenic (plaque-forming) particles moving through the blood.
The danger is that dyslipidemia is completely symptomless. Arterial plaque accumulates quietly over years — without pain, breathlessness, or fatigue — until an acute vascular event occurs.
The South Asian Phenotype: Why Standard Reference Ranges Miss the Mark
Cardiologists regularly see young, active South Asians with "normal" total cholesterol suffer premature cardiac events. This happens because South Asian metabolic genetics often produce what clinicians call the atherogenic dyslipidemia triad:
- High triglycerides: frequently above 150 mg/dL, driven by high-carbohydrate diets, refined grains, and visceral fat stored around vital organs.
- Suboptimal HDL: protective HDL regularly sits below healthy thresholds — under 40 mg/dL for men, under 50 mg/dL for women.
- Small, dense LDL particles (sdLDL): even when calculated LDL looks standard, the particles themselves are smaller, denser, and far more prone to oxidising and sticking to arterial walls.
| Lipid Marker | Conventional View | South Asian Clinical Reality | Key Takeaway |
| Total Cholesterol | Under 200 mg/dL | Can look normal while masking high risk | Misleading when reviewed on its own |
| Triglycerides (TG) | Under 150 mg/dL | Frequently elevated (150 to 250+ mg/dL) | Strong indicator of insulin resistance |
| HDL Cholesterol | Above 40 to 50 mg/dL | Frequently low (under 35 to 40 mg/dL) | Reduced natural vascular cleanup |
| TG : HDL Ratio | Rarely highlighted | Often above 3.0 | A simple, reliable proxy for small dense LDL |
| Non-HDL Cholesterol | Often overlooked | Crucial target (total minus HDL) | Measures all plaque-forming particles combined |
The Understanding Gap in Routine Lipid Panels
Most people only look at their lipid panel after an annual health checkup. When they receive a standard lab report, two problems recur.
1. The false sense of security
When total cholesterol falls in the green, patients routinely ignore borderline-high triglycerides or low HDL. They assume everything is fine, missing a multi-year window in which simple lifestyle shifts could reverse the trend.
2. The isolated out-of-range panic
When a single number sits slightly outside the reference range, patients often panic, turn to unverified internet searches, or cut out healthy fats unnecessarily — without understanding what their overall ratios actually mean.
How NirogGyan Turns Lipid Data into Action
Preventive care only works when people actually understand their results.
Visual risk mapping
Instead of hiding critical values in tight rows of text, NirogGyan Smart Reports display lipid profiles along intuitive, colour-coded spectrums. Patients immediately see where each marker lands across clear risk categories.
Automated key ratios (TG:HDL and non-HDL)
By calculating and explaining metrics such as the TG:HDL ratio and non-HDL cholesterol, the report gives patients a far clearer picture of their metabolic health and insulin sensitivity.
Historical trend lines
Lipid levels change with diet, sleep, physical activity, and medication. NirogGyan tracks past test values over time, giving doctors a clear visual history and giving patients tangible proof of their progress.
Practical Ways to Improve Your Lipid Profile
Addressing dyslipidemia does not require extreme measures. It requires consistent, targeted habits:
- Cut back on refined carbohydrates. High triglycerides are driven primarily by excess sugar, refined flours, and ultra-processed foods — not just dietary fat. Reducing processed carbs lowers triglycerides quickly.
- Prioritise soluble fibre. Oats, lentils, chia seeds, and leafy greens bind to cholesterol in the digestive tract and assist natural elimination.
- Combine Zone 2 cardio with strength training. Regular aerobic exercise and resistance work stimulate lipoprotein lipase activity, raising HDL and speeding up triglyceride clearance.
- Check advanced markers when needed. With a family history of early heart disease, speak to your doctor about testing Apolipoprotein B (ApoB) and Lipoprotein(a) for a deeper view of cardiovascular risk.
Frequently Asked Questions
What is the difference between hyperlipidemia and dyslipidemia?
Hyperlipidemia refers specifically to elevated levels of blood fats, such as high cholesterol or high triglycerides. Dyslipidemia is a broader term covering any imbalance in blood lipids, including low levels of protective HDL.
Why is the TG:HDL ratio so important?
The triglyceride-to-HDL ratio is one of the most practical clinical markers for insulin resistance and the presence of small, dense LDL particles. A ratio above 3.0 — or above 2.0 for tighter metabolic tracking — suggests elevated cardiovascular risk even when total cholesterol looks normal.
Can dyslipidemia be corrected with lifestyle changes alone?
Mild to moderate dyslipidemia caused by diet, low activity, or weight gain can often improve significantly through nutrition, exercise, and weight management. Genetic lipid conditions and high-risk profiles usually require medical guidance and lipid-lowering therapy alongside lifestyle changes.
How do NirogGyan Smart Reports help diagnostic labs and hospitals?
NirogGyan connects directly with existing LIS and EHR systems to turn text-heavy lab reports into visual, easy-to-read Smart Reports. This improves patient understanding, lowers post-report confusion, and drives higher repeat-testing compliance.
Moving from Static Numbers to Real Prevention
A diagnostic test should never be a static receipt of numbers. It should be a clear, actionable guide to better health.
Understanding dyslipidemia means looking beyond single values and seeing the complete metabolic picture. When healthcare providers pair diagnostic testing with intuitive, visual reporting, patients get the clarity they need to protect their long-term health.
Ready to upgrade your laboratory reports to patient-first Smart Reports?
Explore Smart Reports