
Data-Driven Decision Making for Labs: Beyond Internal Dashboards
Author: Joyneel Acharya
Last Updated On: 7th October 2025
Let’s talk honestly about lab data. You’re sitting on a mountain of it. But what are you actually doing with it? If your answer involves pulling up an internal dashboard that neatly summarises what happened yesterday, you’re essentially trying to drive a high-performance vehicle by staring only into the rear-view mirror. It shows you where you’ve been, but it won’t help you see the traffic jam forming up ahead.
This is where a real data-driven decision culture begins. It's about moving beyond those static, historical reports and embracing a forward-looking strategy. We’re talking about putting dynamic data visualization, sharp predictive analytics, and real business intelligence to work. It’s time to transform your data from a dusty archive into your most powerful strategic weapon.
Key Takeaways
- Stop Driving by the Rear-View Mirror: Traditional dashboards show you the past. The future of your lab depends on predictive tools that show you what’s coming next.
- Data Isn't a Spectator Sport: A data-driven culture isn't one person staring at a screen. It's about making data insights part of every conversation and empowering your whole team to make smarter choices.
- Your Software Is Your Launchpad: Don't let outdated lab management software hold you back. To truly leverage advanced analytics, you need a modern, AI-powered platform that can grow with you.
- Proactive is the New Profitable: The true magic of predictive analytics is moving from a state of constant fire-fighting to one of calm, strategic foresight. Anticipate problems; don't just react to them.
Understanding the Role of Data Visualization in Lab Decision Making
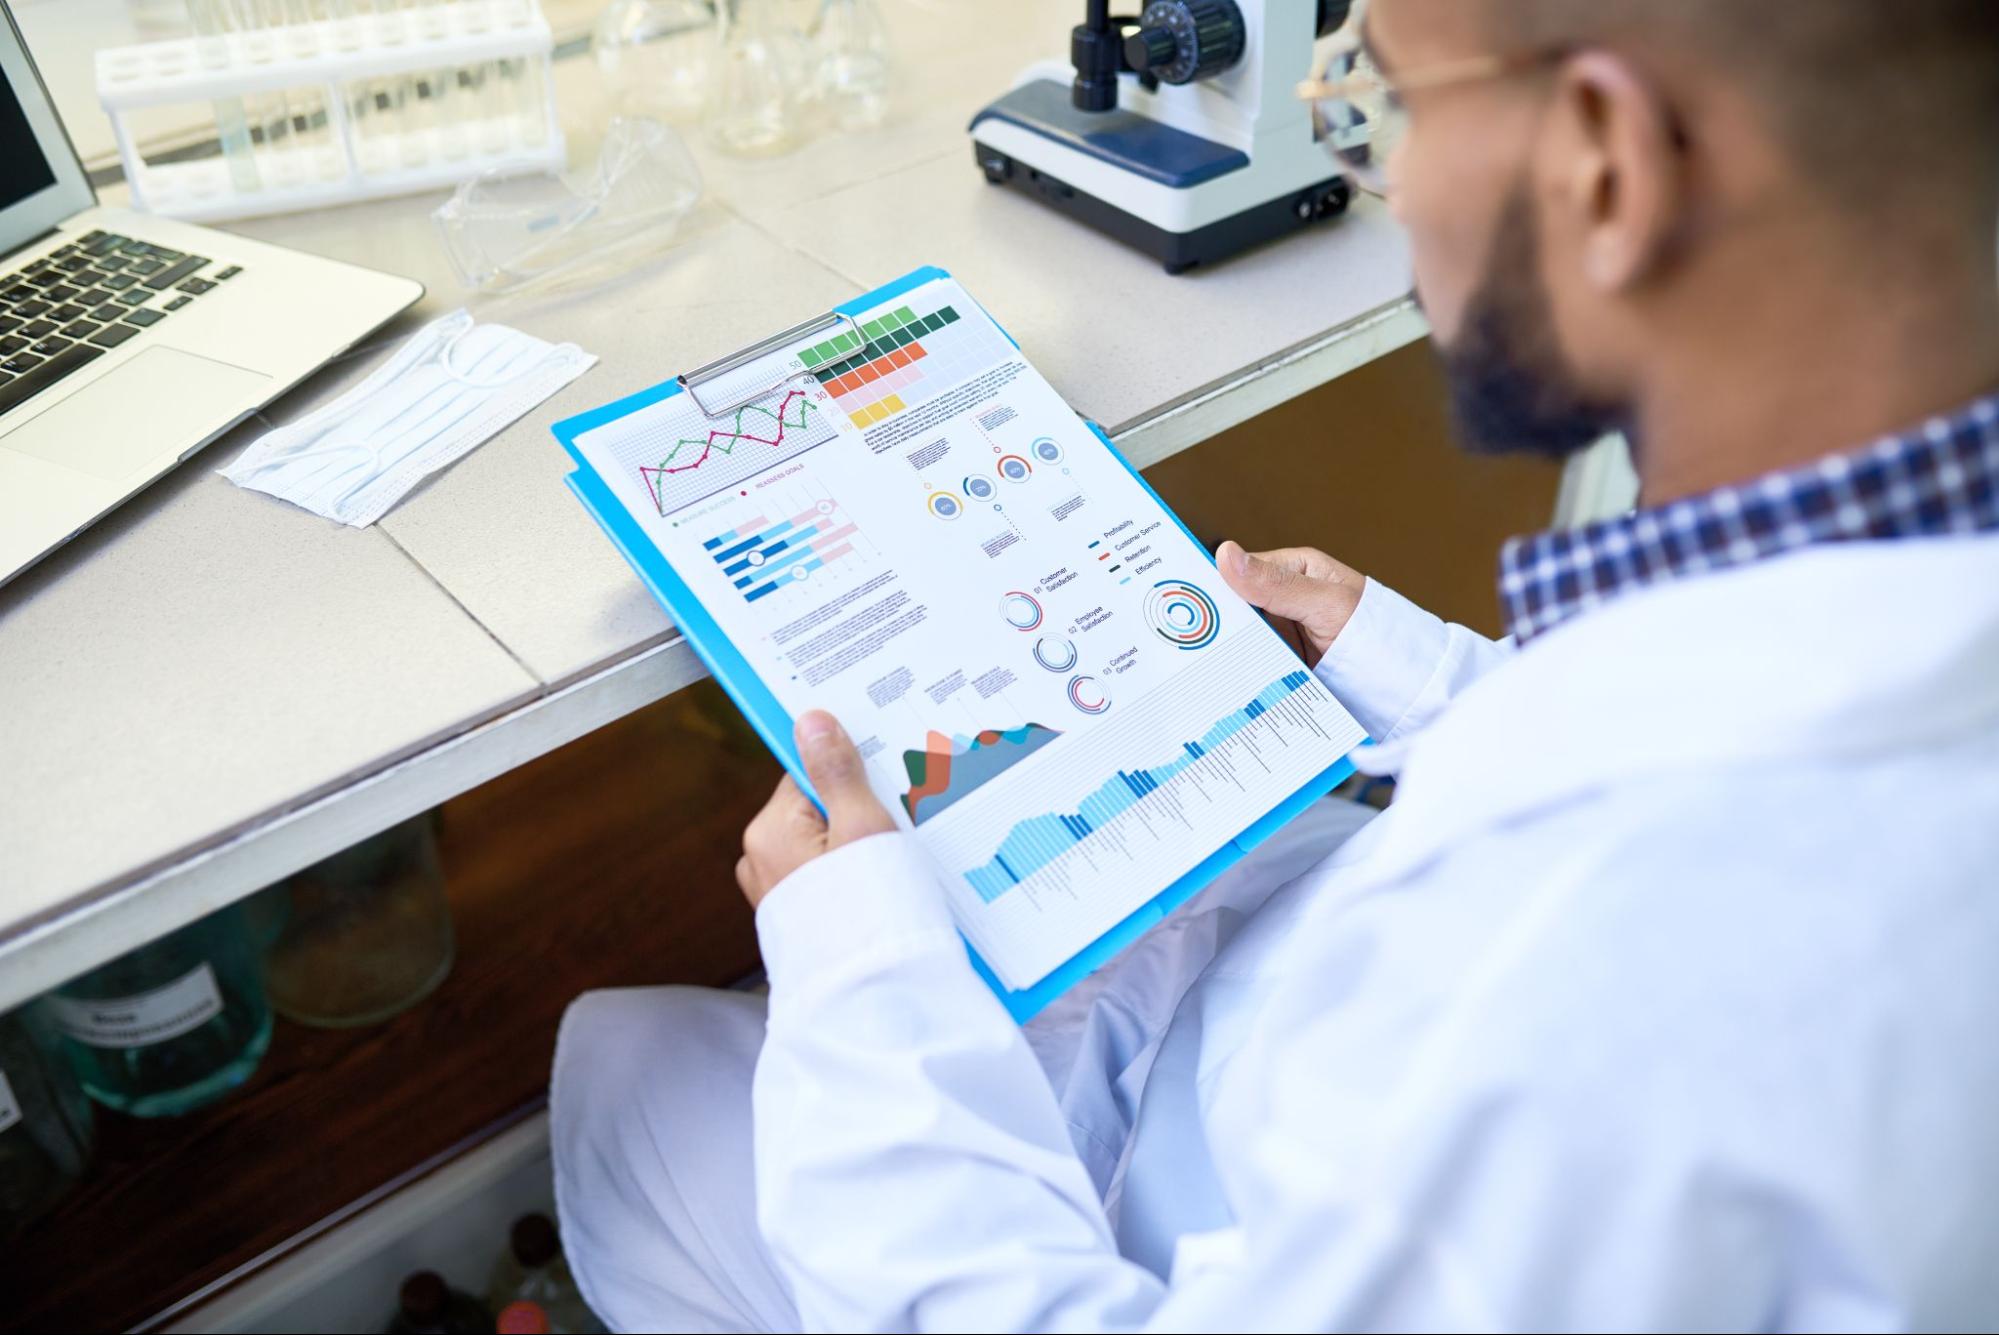
Forget about making charts for a moment. Think about telling a story. That's what powerful data visualization truly is. It takes a complex, messy spreadsheet of lab data and turns it into a clear, compelling narrative that anyone, from the bench to the boardroom, can understand. Advanced data analytics visualization lets you interact with that story, ask it questions, and uncover the critical data insights that numbers alone will always hide.
When your data tells a story, the benefits are immediate:
- It smashes silos: Technicians and managers finally have a common language, breaking down the walls between departments.
- It creates clarity: By pulling everything into one place, you get a single, unified view, ending the confusion of competing reports.
- It makes you faster: A visual summary is intuitive. You can grasp a problem and react in seconds, not hours.
Imagine a lab manager who, instead of digging through reports, spots a sample processing bottleneck on an interactive chart. That visual red flag allows for an immediate, targeted fix that boosts efficiency and directly impacts patient outcomes. That’s the difference between data and a story.
Limitations of Traditional Internal Dashboards in Labs
We've all seen them. The standard data dashboards offer a fixed, predictable set of metrics. The problem is, they are fundamentally stuck in the past. These reports are often obsolete the moment they're generated, completely out of sync with the real-time pace of a modern lab. They can't connect the dots between your different instruments and systems, leaving you with a fragmented, cluttered view of your lab analytics that confuses more than it clarifies.
These are the frustrations that hold labs back:
- Static reports offering a snapshot of yesterday’s news.
- Poor integration that makes a cohesive view of your lab almost impossible.
- A complete inability to model the future or ask "what-if".
- Overwhelming interfaces that drown you in details, hiding the crucial data insights.
A manager relying on a tool like this is flying blind. They are guaranteed to miss the early warning signs of equipment failure or a growing workflow issue, trapping them in a constant state of reactive firefighting.
Leveraging Predictive Analytics to Anticipate Lab Outcomes
What if you could see the future? Not with a crystal ball, but with your own data. This is the game-changing power of predictive analytics. By analysing historical and real-time patterns, predictive models can flag what’s likely to happen next, allowing you to move from a reactive posture to a proactive one. This shift is the very essence of a modern data-driven decision culture.
Think about what this means for your lab analytics:
- Forecasting Demand: Accurately predict test volumes so you can adjust staffing before a bottleneck ever forms.
- Smart Inventory: Know precisely when you'll need more reagents, ending both costly overstocking and stressful last-minute orders.
- Proactive Maintenance: Get an alert that a machine needs servicing before it breaks down, preventing catastrophic, unplanned downtime.
A clinical lab I know used predictive analytics and got an early warning about an impending instrument failure. They scheduled maintenance during a quiet period, completely sidestepping what would have been a major operational crisis. That's not just reporting; that's a strategic advantage.
Integrating Business Intelligence for Comprehensive Lab Insights
Your lab’s data doesn’t live in a single spreadsheet. It flows from your LIMS, your instruments, your quality control systems everywhere. Business intelligence (BI) acts as the central command centre, bringing all these streams together into a single, coherent picture. A proper BI platform offers data analytics visualization that goes miles beyond a simple dashboard, enabling deep analysis and real-time monitoring of your entire operation.
When you integrate BI, you unlock:
- A Single Source of Truth: A unified view that combines information from everywhere to give you the whole story.
- Automated Intelligence: Effortlessly benchmark performance, analyse costs, and track key metrics without manual effort.
- A Proactive Edge: Leverage built-in predictive analytics to get ahead of maintenance and inventory needs.
Picture a lab using a BI dashboard to spot a subtle lag in turnaround times. By correlating this with staffing schedules, they can dynamically shift resources, crushing their performance targets. This is how you start commanding your data, not just managing it.
Choosing the Right Lab Management Software to Support Advanced Analytics
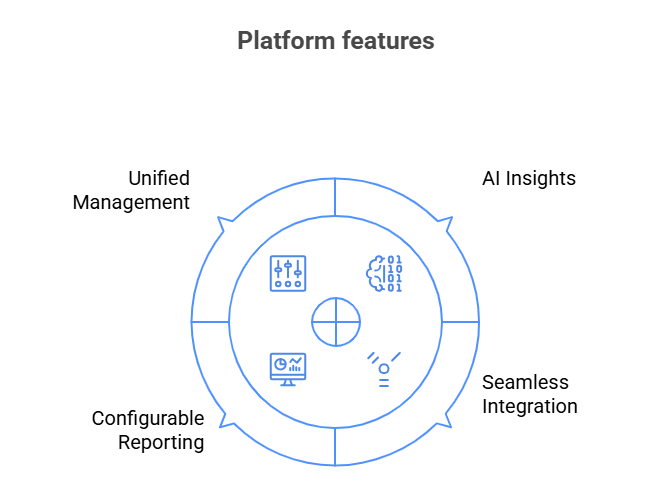
Let’s be direct: your ambitions for advanced lab analytics are completely dependent on the software you use. When you’re choosing a lab management software, you need to look beyond the basic features. You need a platform built for the future, one that has powerful data analytics, visualization, and AI baked into its core.
Insist on these key features:
- AI-Powered Insights: The system must offer predictive capabilities for maintenance, workflows, and forecasting.
- Effortless Integration: It has to connect seamlessly with all your instruments and data sources. No exceptions.
- Reporting on Your Terms: You need configurable dashboards that you can tailor to track your lab’s KPIs.
- Unified Command: The best platforms manage everything samples, inventory, quality in one place.
Choosing an adaptable, future-ready software is the foundational step toward building a truly data-driven environment.
Practical Steps to Implement Data-Driven Decision Making Beyond Dashboards
Making this leap isn’t just about buying new software; it's about changing your culture. It's a shift in mindset that starts by asking a simple question: "What problem are we trying to solve?" From there, you can build a framework that turns data and decision-making into a daily habit, not a quarterly report.
Here are five pragmatic steps to get you there:
- Define Your Mission: Set clear, measurable goals. Not "improve efficiency," but "cut sample turnaround time by 15%".
- Measure What Matters: Choose KPIs that directly track progress toward those goals. Ignore the vanity metrics.
- Connect the Dots: Tear down the data silos. Make sure all relevant data is fed into one central system.
- Make it a Ritual: Weave data into the fabric of your team meetings. Make discussing the data visualization charts a non-negotiable part of the agenda.
- Empower Your People: Foster a culture of curiosity. Train your team and encourage everyone to ask questions of the data.
When a lab starts actively tracking KPIs, it can proactively adjust inventory and staffing, leading to immediate savings and a calmer, more efficient workplace.
Case Studies: Successful Data Visualization and Analytics in Labs
This isn't just theory. Labs are achieving incredible results with these tools right now. Look at the DHCS Long Term Services and Supports dashboard, which transformed patient care by integrating lab analytics data to provide targeted support. Or consider Mayo Clinic’s Health Insights Program, which uses predictive analytics to forecast disease risks, paving the way for truly personalised medicine.
These successes aren't accidents. They are built on a few core principles:
- A laser focus on creating tools that are clear, flexible, and designed for the people who actually use them.
- The wisdom to integrate diverse data sources to get rich, comprehensive data insights.
- A commitment to listening to feedback and constantly making the system better.
By adopting these principles, any lab can unlock smarter decisions that elevate everything they do.
Overcoming Challenges in Adopting Advanced Data Visualization in Labs
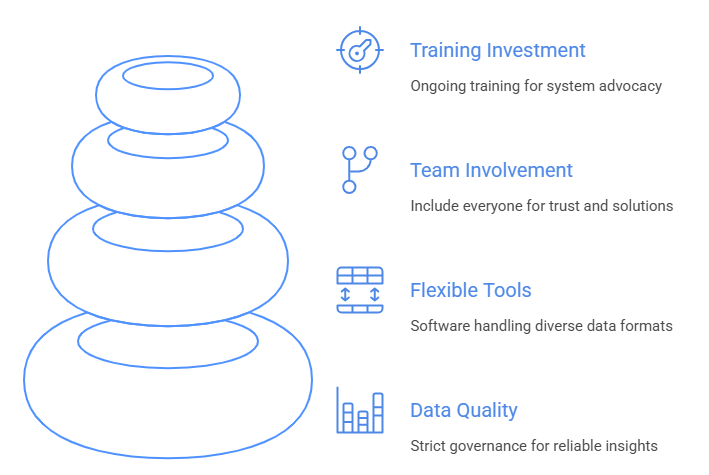
Of course, this journey isn't always a straight line. It comes with hurdles, from messy data to the simple fact that people are often resistant to change. Acknowledging these challenges is the first step to conquering them.
Here’s how to navigate the common roadblocks:
- Obsess Over Data Quality: You can't build a strong house on a weak foundation. Implement strict data governance from day one. Great data insights demand great data.
- Choose Flexible Tools: Don't get locked into a rigid lab management software. Select tools that can handle multiple data formats and sources with ease.
- Build it Together: Involve everyone in the process from the beginning. This builds trust and ensures the solution actually solves their problems.
- Invest in Your Team: Provide excellent, ongoing training. Show people how the new system makes their jobs easier, and you'll turn sceptics into your biggest advocates for your new data-driven decision framework.
Conclusion: Unlocking the Full Potential of Data Visualization for Lab Success
In today’s world, your lab’s data is its most valuable and most underutilised asset. Advanced data visualization and analytics are the keys that unlock that value. To thrive, labs must move beyond the static rear-view mirror of old dashboards and foster a culture of proactive, data-driven decision making.
To unleash the full power of your data and decision making, focus on three things:
- Integrate: Bring all your data together for a single, unified view.
- Predict: Use predictive analytics to see what's coming before it arrives.
- Collaborate: Build a data-fluent culture through continuous training and teamwork.
By choosing flexible lab management software and committing to data quality, you can turn data into your ultimate competitive advantage, ensuring your lab is ready to define the future, not just react to it.
Frequently Asked Questions (FAQs)
1. Seriously, why are my current lab dashboards not good enough?
Because they’re a snapshot of the past. They're static, they can't connect the dots between your different systems, and they have zero predictive capabilities. While they might tell you why something went wrong yesterday, they can't help you prevent it from happening again tomorrow.
2. How does predictive analytics actually help in a real-world lab?
Predictive analytics acts like an early warning system. It helps you forecast everything from equipment maintenance needs to test volumes and reagent usage. This lets you get ahead of problems, preventing downtime, reducing costs, and ensuring you have the right staff on hand, which directly improves efficiency and patient care.
3. What exactly is 'business intelligence' and why should my lab care?
Think of business intelligence (BI) as the central nervous system for your lab's data. It pulls information from your LIMS, instruments, and everything else into one unified, living picture. It allows for real-time monitoring, deep performance analysis, and the predictive insights you need to make fast, evidence-based decisions instead of guessing.
4. If I'm upgrading, what are the must-have features in a modern lab management software?
You should be looking for a platform built for the future. Prioritise AI-driven analytics for predictive power, seamless integration with all your instruments, real-time data capture, and dashboards you can actually customise to your needs. And make sure it’s secure and cloud-based, giving you the flexibility to grow and adapt.
5. How do we start making this shift to being data-driven without overwhelming everyone?
You start small and make it about people, not just technology. First, define clear, simple goals (KPIs) and integrate your data sources. Most importantly, make data a part of your daily routine. Put the charts up in your team meetings and talk about them. Provide good training and show your team how data helps them solve real problems, and you'll build the culture from the ground up.
“Get your smart health report with NirogGyan and understand your lab results in minutes - clear, simple, and doctor-ready.”