TL;DR / Quick Summary
- The statistical trap: standard laboratory reference ranges are based on a 95% statistical bell curve. That means roughly 1 in 20 completely healthy individuals will naturally fall slightly outside the "normal" bracket on any given day.
- Enzymes and counts are dynamic: routine biological factors, such as lifting weights 48 hours prior, taking an everyday painkiller, mild dehydration, or recovering from a common cold, routinely cause transient spikes in liver enzymes, white cells, or platelets.
- Think patterns, not solo digits: doctors diagnose through biological patterns and trajectories, never an isolated decimal point sitting two units past an arbitrary cutoff.
- Immediate clarity: rather than falling down an alarming midnight search rabbit hole, upload your report to NirogGyan's free Lab Report Analyzer to convert raw clinical tables into a visual, plain-language health summary.
The Midnight Google Trap: Why Lab Flags Trigger False Alarms
Few experiences induce immediate dread quite like opening an annual health checkup PDF and seeing bold red font, exclamation marks, or asterisks.
You felt completely energetic when you walked into the diagnostic center. Yet, within ten minutes of searching your "high" markers online, you are convinced you have end-stage organ damage.
This psychological whiplash happens because standard diagnostic reports present biochemistry as a binary pass-fail exam. If a value falls inside the bracket, you pass; if it lands one point outside, the interface visually sounds an alarm.
Human biology does not operate on digital switches. It operates along fluid, adaptive continuums. An out-of-range flag is rarely a diagnosis; it is simply a signal to pause, evaluate context, and look for patterns.
The Science of the "Normal" Range: Why 5% of Healthy People Flag Red
To interpret an elevated test result calmly, it helps to understand how diagnostic laboratories establish their reference intervals.
- The 95% Bell Curve: a lab tests hundreds of verified healthy individuals and calculates the mathematical average. They set the "normal range" to include the middle 95% of those healthy results.
- The Built-In Outliers: by mathematical definition, 2.5% of completely healthy people sit above the upper limit, and 2.5% sit below the lower limit. If you run a comprehensive 60-parameter executive checkup, probability alone dictates that you will trigger at least two or three "abnormal" flags purely by chance.
- Inter-Lab Variation: different diagnostic chains calibrate their automated analyzers using distinct chemical reagents and calibration kits. A reading of 48 U/L might flag as "High" in Lab A (cutoff 45) while sitting comfortably inside "Normal" in Lab B (cutoff 55).
A number that sits just outside a statistical bracket is not automatic evidence of pathology.
4 Common "High" Flags and Their Non-Scary Explanations
Here is a closer look at four of the most frequently flagged biomarkers on routine Indian health checkups, along with the everyday physiological factors that cause them to rise.
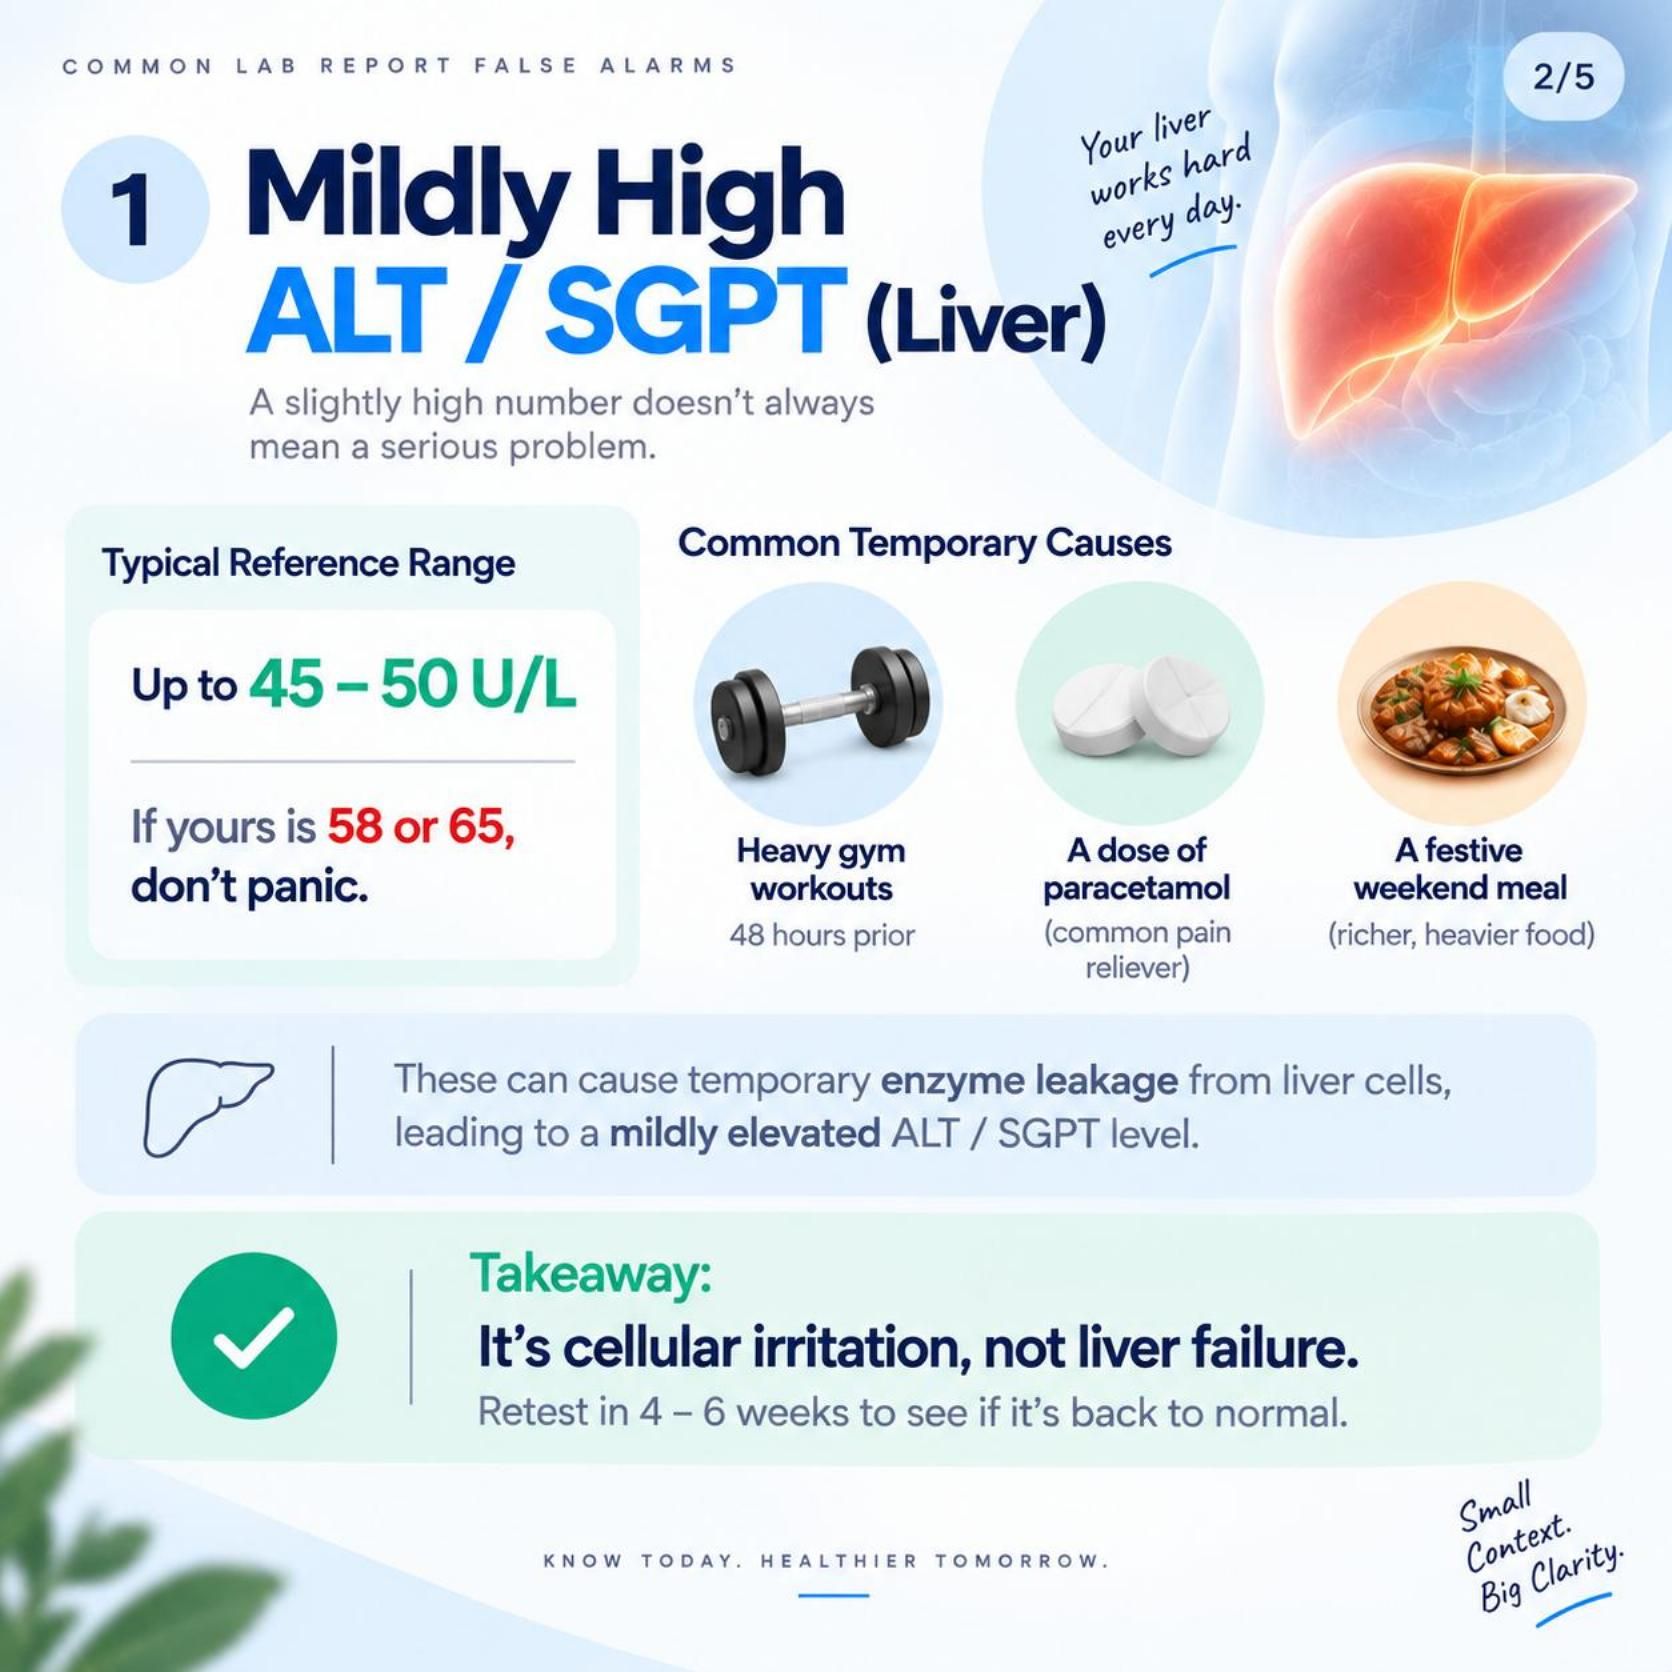
1. Mildly High ALT / SGPT (50 to 80 U/L)
The Fear: irreversible liver damage or hepatitis.
The Reality: Alanine aminotransferase (ALT) is an enzyme that lives inside liver cells. When liver cells experience mild tension, microscopic amounts spill into the blood.
Everyday Triggers: taking a routine painkiller (like paracetamol) for a headache, drinking alcohol over the weekend, or eating heavy, fried meals prior to testing. In urban India, the most common long-term driver is mild metabolic fatty liver (MASLD), which is completely reversible through simple dietary modifications and daily walking.
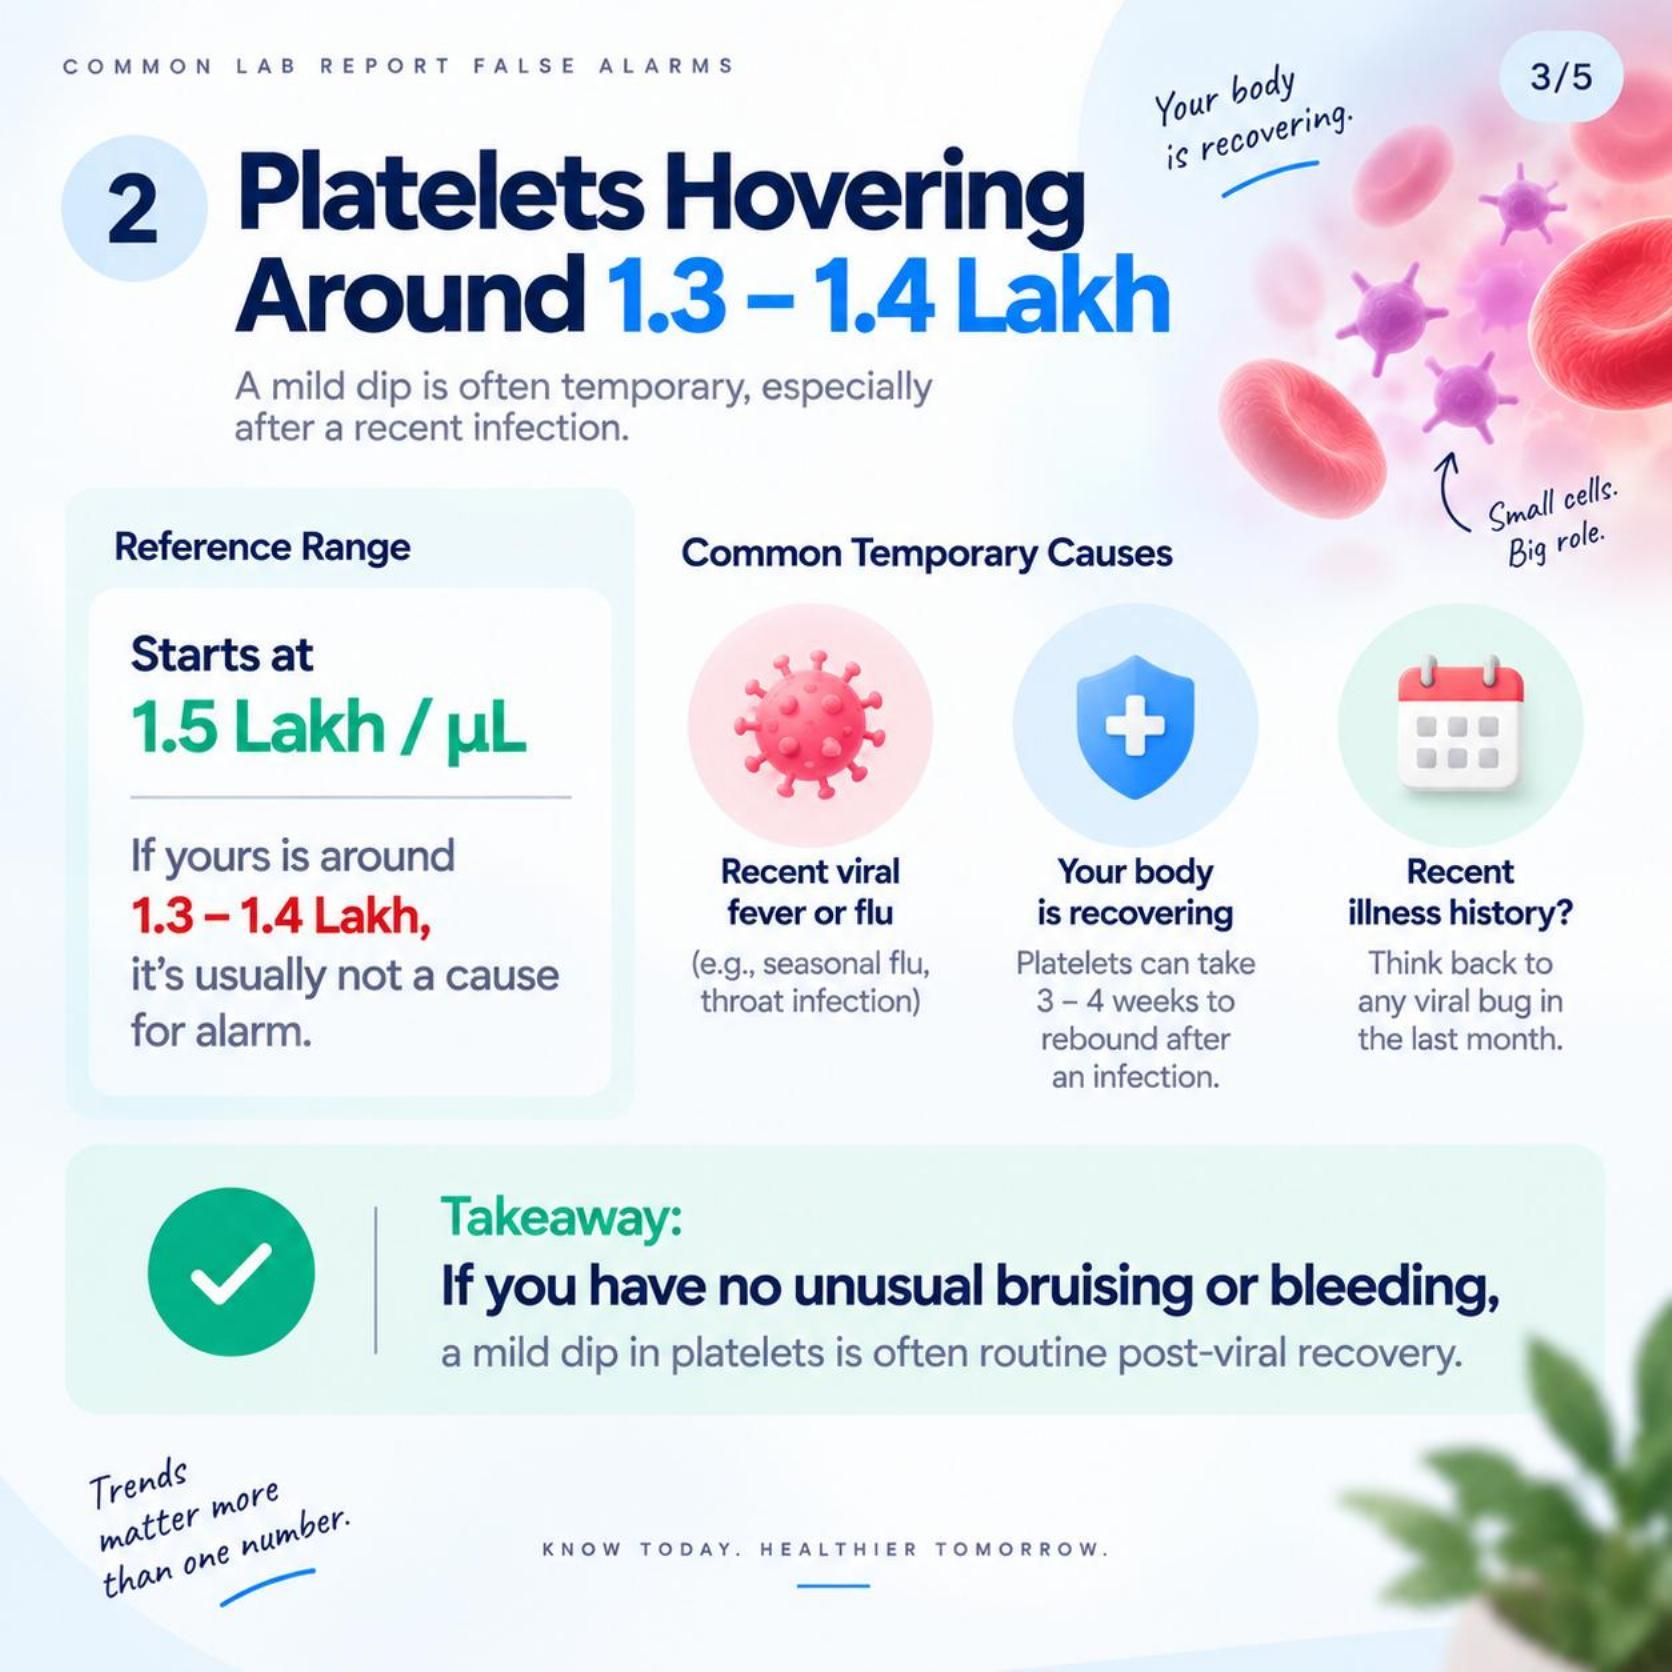
2. High Total White Blood Cell Count (11,000 to 13,500 cells/mcL)
The Fear: bone marrow disorders or severe systemic infections.
The Reality: white blood cells are your immune system's active responders. An elevated count (leukocytosis) usually indicates that your immune defenses are responding appropriately to everyday friction.
Everyday Triggers: clearing a lingering common cold, a minor toothache or gum inflammation, seasonal allergies, a skin breakout, or acute mental stress. Strenuous exercise right before a blood draw can also cause white cells pooled along blood vessel walls to enter circulation, causing an artificial spike.
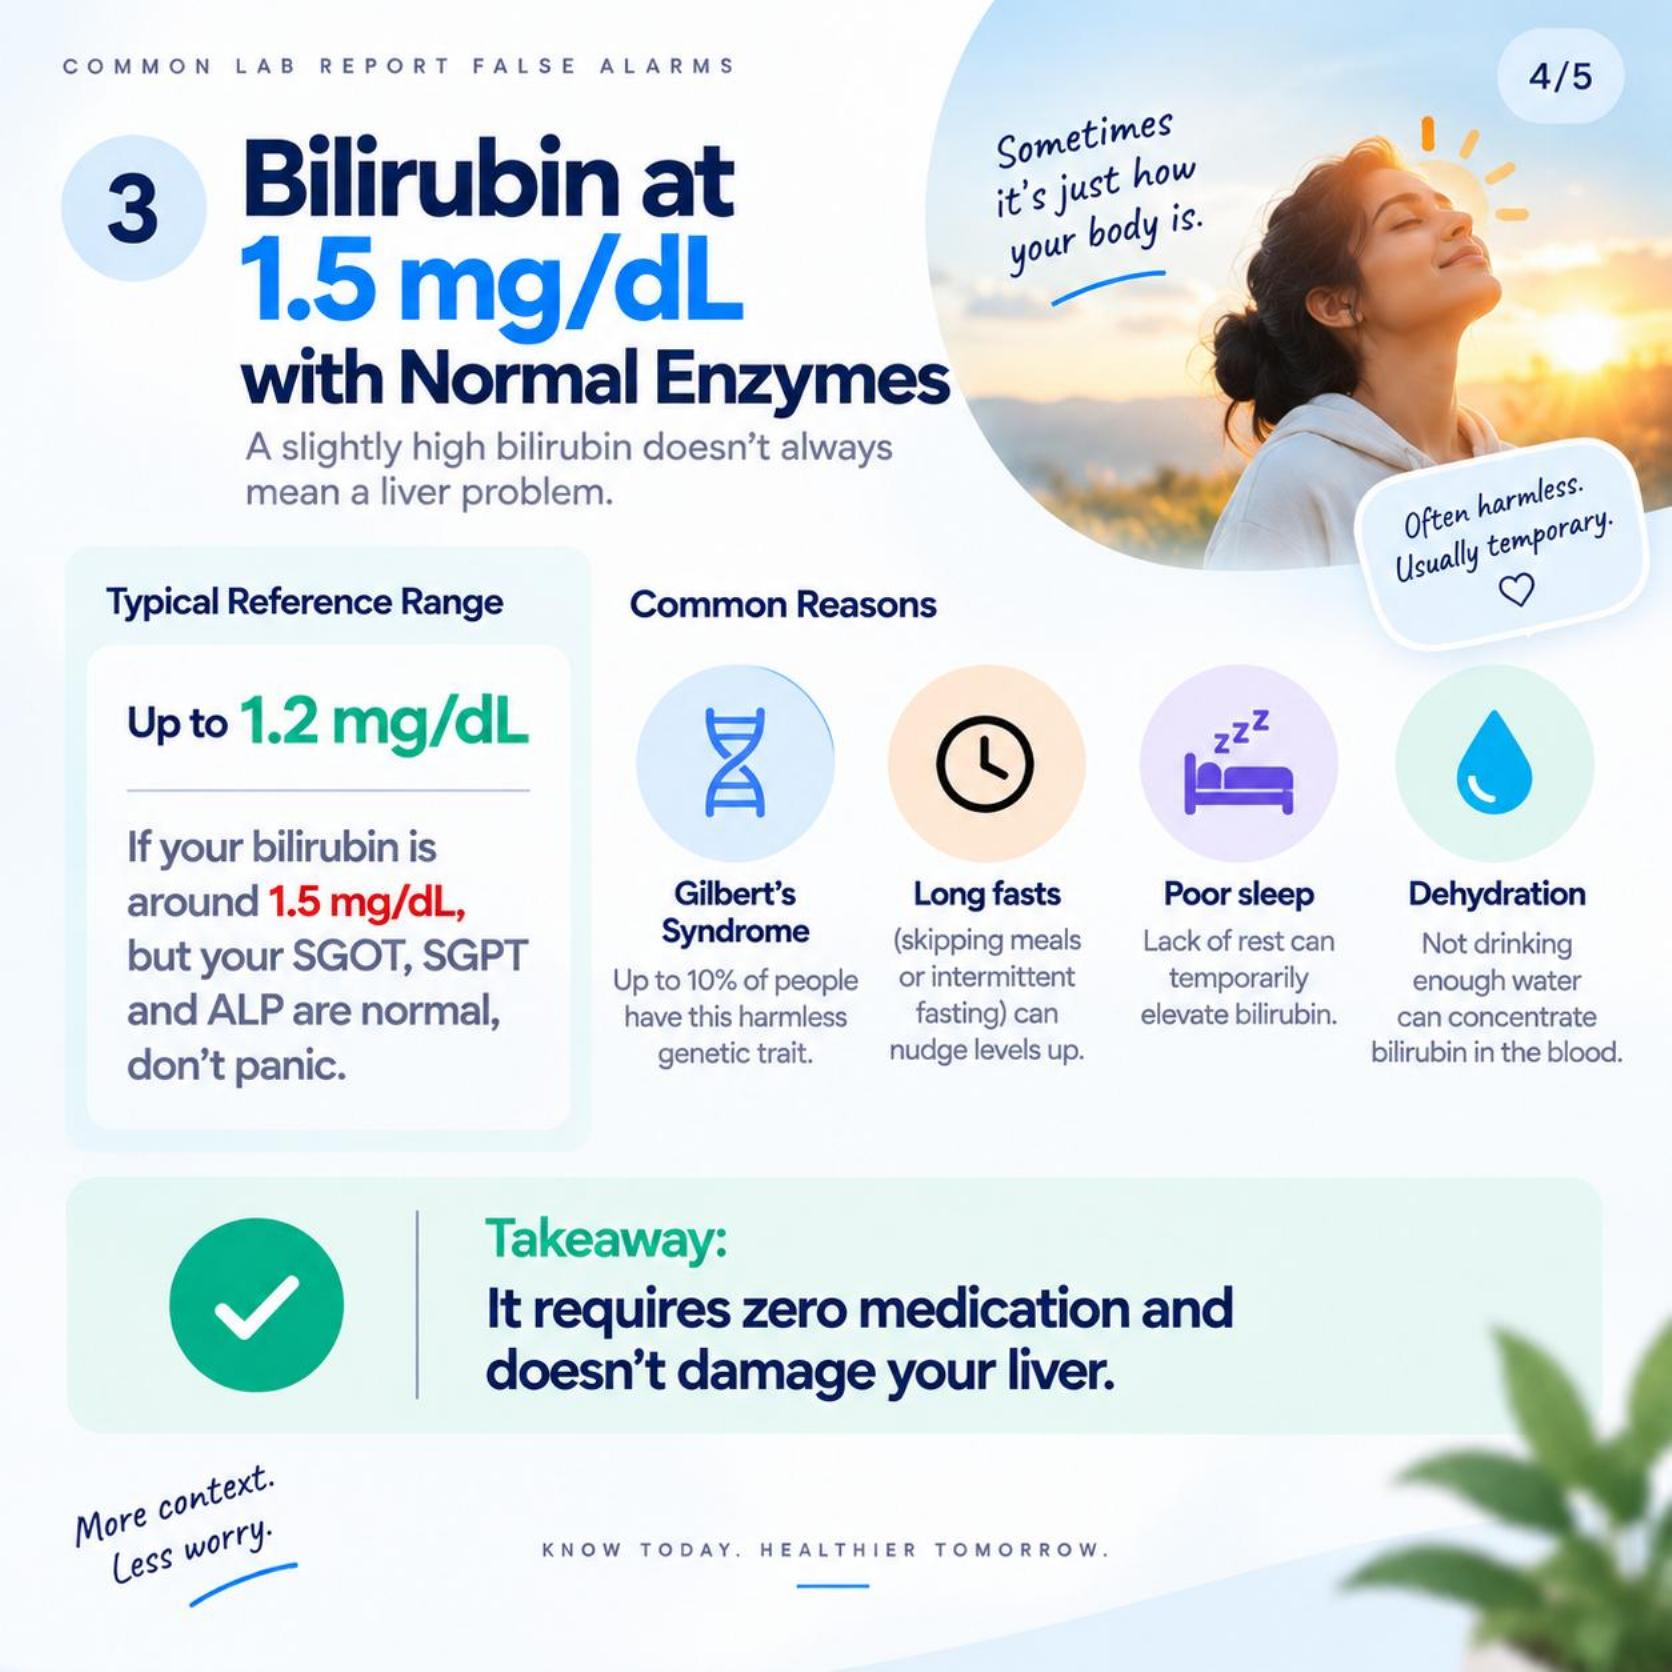
3. Mildly Elevated Total Bilirubin (1.3 to 2.2 mg/dL)
The Fear: jaundice or bile duct obstruction.
The Reality: if your Total Bilirubin is slightly elevated, but your Direct Bilirubin and liver enzymes (ALT, AST, ALP) are completely normal, you likely have Gilbert's syndrome.
Everyday Triggers: affecting up to 10% of the population, Gilbert's syndrome is a harmless genetic trait where the liver processes bilirubin slightly slower. Levels typically bump up during religious fasting, dehydration, poor sleep, or periods of work stress. It requires zero medication and does not harm your health.
4. High Uric Acid (7.2 to 8.5 mg/dL)
The Fear: immediate, painful gout or kidney stones.
The Reality: uric acid is a byproduct of purine metabolism. The vast majority of people with mildly elevated uric acid (asymptomatic hyperuricemia) never develop gout.
Everyday Triggers: testing while mildly dehydrated, consuming high-purine foods (such as red meat, seafood, or concentrated lentils/dal) the night before, or consuming high-fructose beverages. Proper hydration alone frequently brings this marker back into range.
Reading Lab Numbers Alone vs. Using an AI Analyzer
When you read a lab report manually, you are forced to interpret complex, interdependent biochemistry using tools built for 1990s desktop printers. Intelligent reporting systems transform this data into a meaningful, structured narrative.
| Evaluation Dimension | Reading Isolated PDF Numbers | Using NirogGyan's Smart Report Analyzer |
| Visual Framing | High-contrast black text with anxiety-inducing red flags. | Calm, color-coded spectrums showing exact degrees of drift. |
| Systemic Grouping | Alphabetized or disjointed lists of 40+ isolated tests. | Categorized by organ systems (Cardiovascular, Liver, Kidney, Metabolism). |
| Pattern Recognition | Evaluates each marker as an isolated silo. | Correlates interdependent markers (e.g., links ALT + Triglycerides + Fasting Glucose). |
| Confounder Identification | Leaves you unaware that exercise, diet, or vitamins caused a spike. | Flags common lifestyle, medication, and dietary confounders. |
| Calculated Ratios | Completely omits advanced ratios (like TG:HDL, AST:ALT, eGFR adjustments). | Automatically calculates and contextualizes essential biological ratios. |
| Doctor Communication | Leads to unfocused consultations driven by fear. | Equips you with structured, informed questions for your physician. |
The 4-Step De-escalation Protocol: What to Do Before You Retest
If your routine blood report shows mild out-of-range elevations and you have no acute physical symptoms, follow this practical de-escalation protocol.
1. Check the Magnitude of Elevation
In medicine, degree matters. A marker that is 10% to 25% above the reference limit (e.g., an ALT of 55 when the cutoff is 45) is a mild drift. True clinical emergencies typically involve values three to ten times above normal (e.g., an ALT of 500+).
2. Audit the 72 Hours Prior to the Blood Draw
Ask yourself:
- Did I lift heavy weights or run intensely within 3 days of testing? (Can elevate AST, ALT, Creatine Kinase.)
- Did I take over-the-counter painkillers, cough syrups, or antibiotics? (Can transiently shift liver and kidney parameters.)
- Was I sufficiently hydrated? (Dehydration falsely concentrates RBCs, hemoglobin, urea, and uric acid.)
- Did I fast for longer than 14 hours? (Prolonged starvation spikes bilirubin and free fatty acids.)
3. Implement Basic Lifestyle Support
Give your body a clean slate for four weeks: drink 2.5 to 3 liters of water daily, remove alcohol, cut out refined flours and sugary drinks, and prioritize seven to eight hours of sound sleep.
4. Retest Under Controlled Conditions
Do not rush to repeat the test the next morning; cellular turnover takes time. Schedule a repeat test with your doctor in 4 to 8 weeks. Ensure you are well-hydrated, rested, and avoid heavy gym sessions for 72 hours prior to the draw.
Frequently Asked Questions
Does an elevated test result always indicate a chronic illness?
No. An elevated result simply reflects the concentration of a biomarker in your blood at the exact moment of sampling. Temporary physiological states, such as dehydration, recent strenuous exercise, seasonal viral recovery, minor infections, or temporary emotional stress, routinely cause transient spikes that resolve on their own.
How do I know if an elevated number is an emergency?
True clinical emergencies are characterized by extreme numerical elevations (such as markers sitting 5 to 10 times above normal) and are almost always accompanied by distinct physical symptoms, such as severe jaundice, unexplained bleeding, high fever, chest pain, or shortness of breath. A mild elevation discovered by chance on a routine checkup in an asymptomatic individual is rarely an urgent emergency.
Why did one lab flag my result as "High" when another lab called it "Normal"?
Diagnostic laboratories use automated testing machinery and chemical reagents from different manufacturers. Because each testing platform has its own calibration metrics and baseline validation groups, reference intervals vary between labs. Your result should always be evaluated in the context of the specific laboratory's verified range.
Can stress or poor sleep cause abnormal lab numbers?
Yes. Acute or chronic stress elevates cortisol and adrenaline, which can temporarily increase blood glucose, shift white blood cell differentials (increasing neutrophils and lowering lymphocytes), and nudge blood pressure and inflammatory markers higher. Poor sleep also impairs insulin sensitivity and elevates liver enzymes.
What should I bring to my doctor's appointment?
Bring your complete laboratory report (not just the flagged values) along with any past test reports from previous years. Having historical data allows your physician to assess your personal biological trajectory rather than judging a single snapshot.
Turn Diagnostic Anxiety into Preventive Health
An abnormal lab report should not be a trigger for panic. It is a tool for proactive health literacy.
Your body is a resilient, dynamic system that continually self-corrects. When an enzyme or cell count registers slightly above normal, treat it as constructive biological feedback. Audit your daily habits, examine the wider pattern of your health, and use clear data to have a productive conversation with your physician.
Ready to decode your complete blood report in plain English?
Upload Your Report Free